

Advanced Report
Generate custom utilization and performance reports with advanced filtering by machine, department, shift, date range, and time interval.
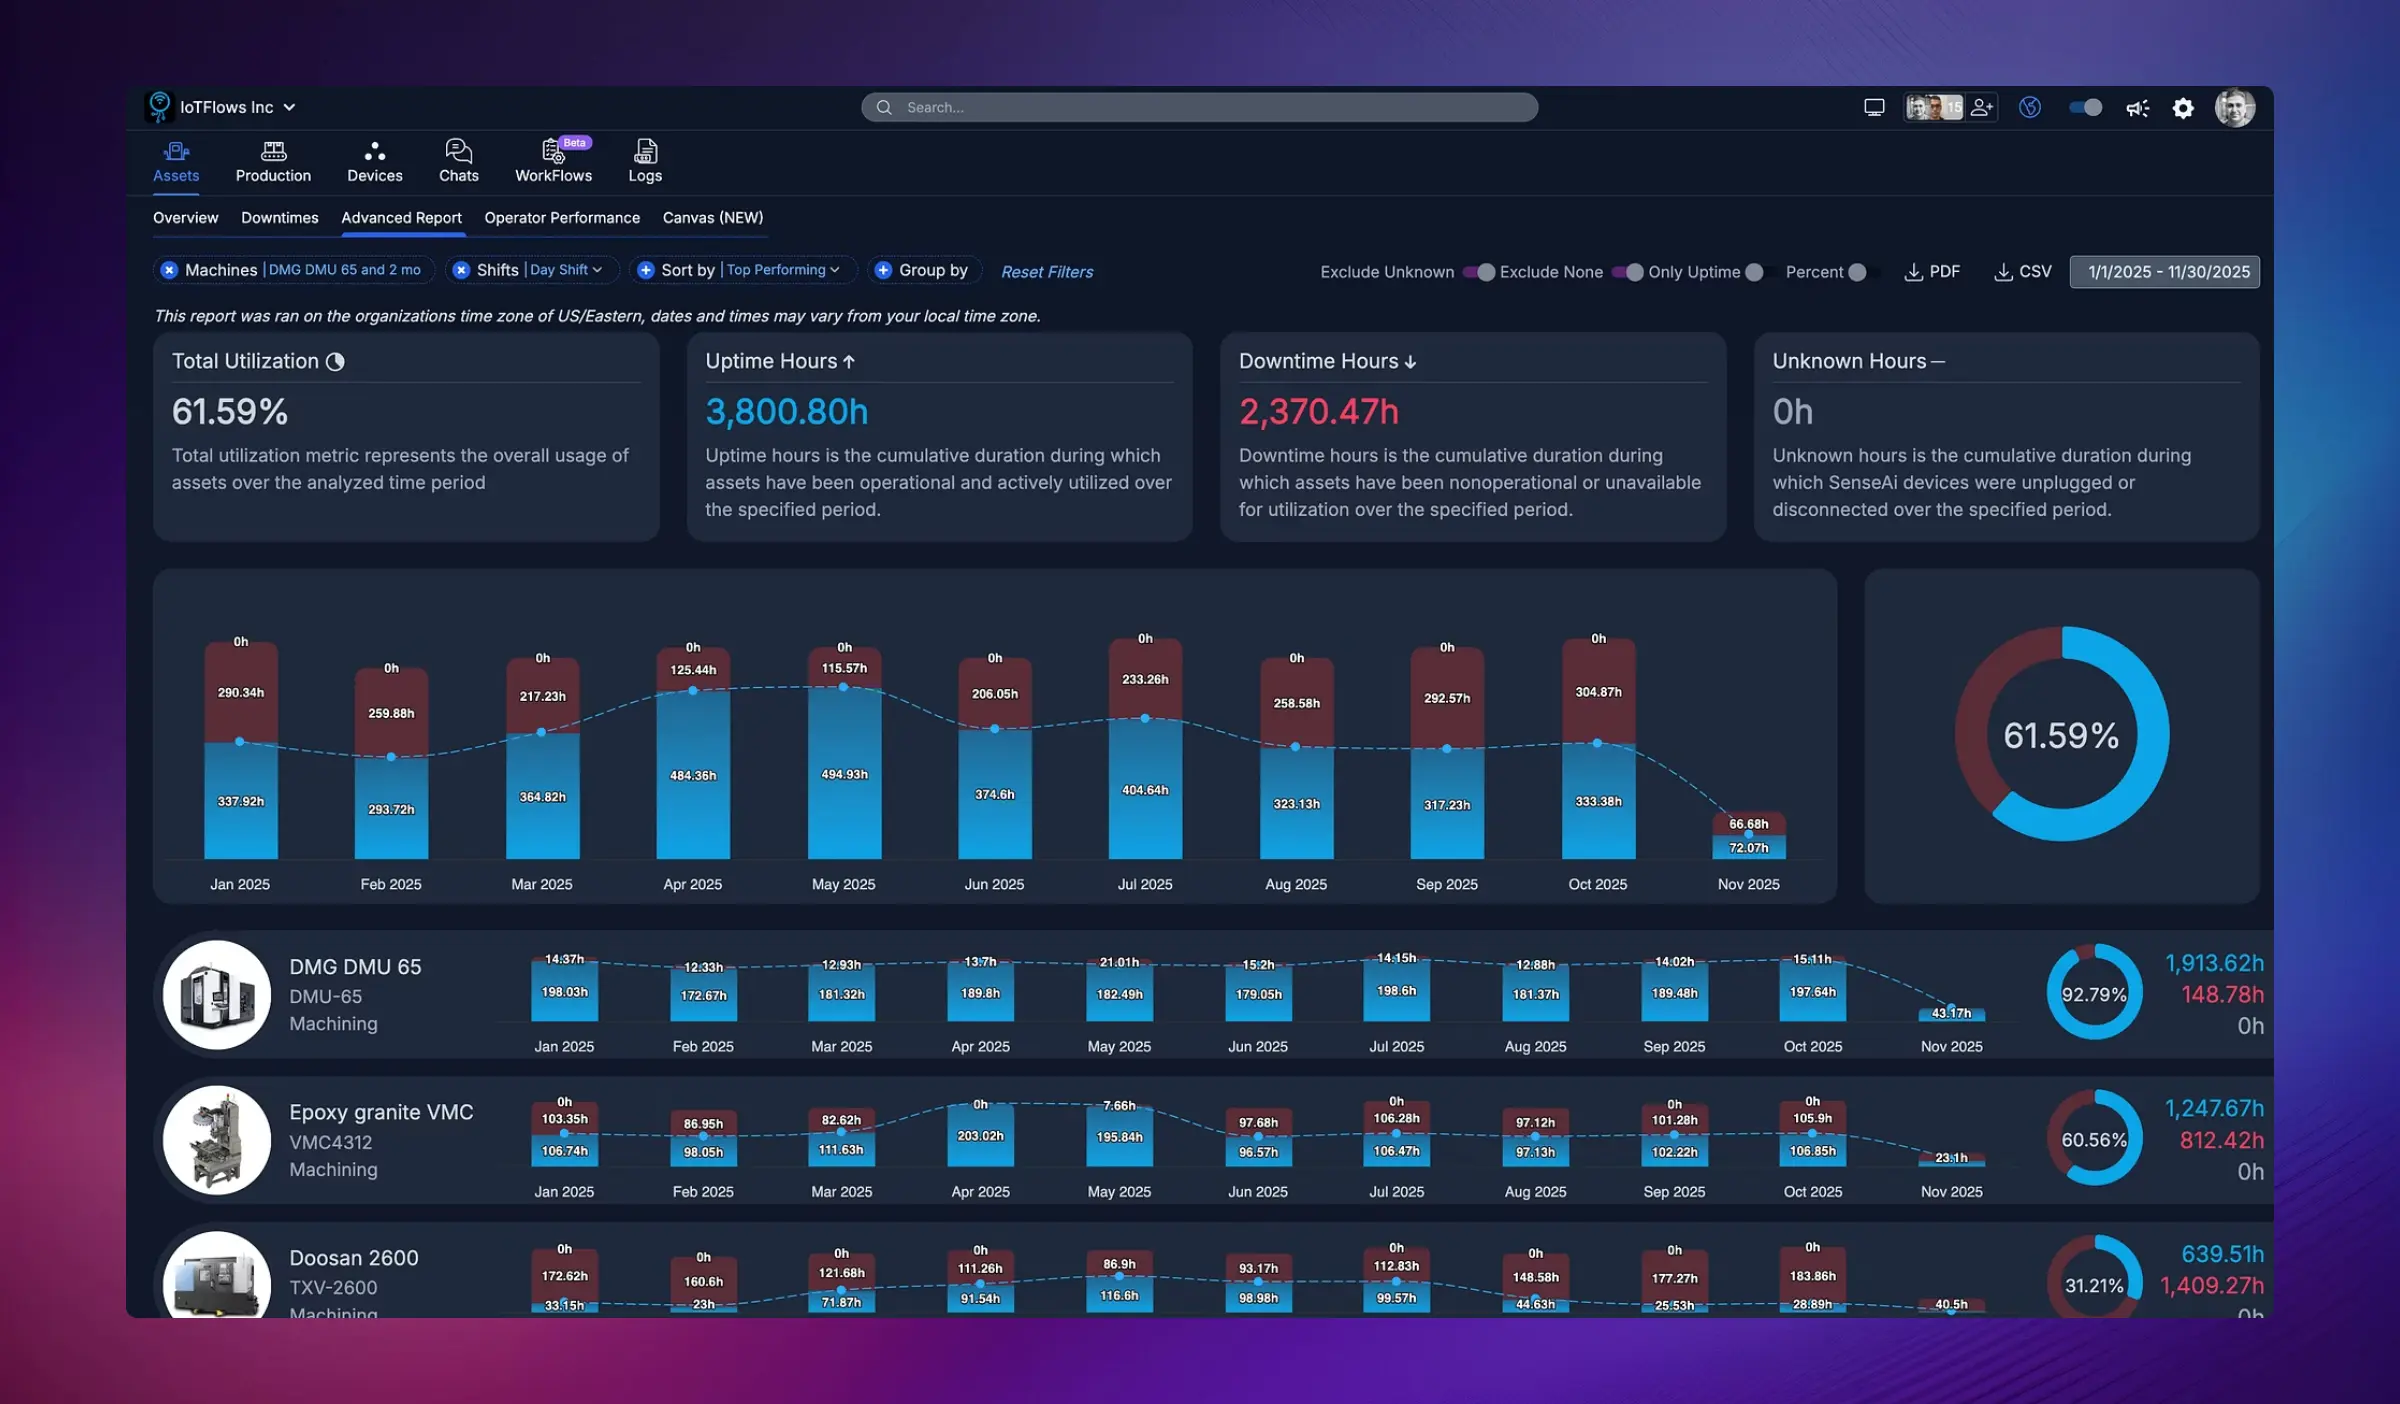
Overview
The Advanced Report is your most powerful analytics tool for deep-dive analysis of machine utilization, performance, and production data. Unlike real-time dashboards, Advanced Report lets you create highly customized reports with precise filtering, date range selection, and time interval grouping to answer specific operational questions.
Perfect for:
- Monthly or quarterly performance reviews
- Comparing departments or shifts
- Tracking improvement initiatives over time
- Generating executive reports and KPI summaries
- Analyzing specific time periods or events
- Exporting data for external analysis
Key Features
Comprehensive Filtering
Filter your analysis by multiple criteria simultaneously:
By Machine/Asset
- Select specific machines
- Choose multiple assets for comparison
- Include all machines in a department
- Filter by machine tags or groups
By Department
- View department-level performance
- Compare multiple departments side-by-side
- Analyze cross-departmental trends
By Shift
- Filter by specific shifts (Day, Night, Weekend, etc.)
- Compare shift performance
- Analyze 24/7 operations across all shifts
By Date Range
- Custom date range selection (any start and end date)
- Pre-defined ranges (Last 7 days, Last month, Last quarter, etc.)
- Year-over-year comparisons
- Specific event date ranges
By Time Interval
- Hourly: See performance broken down hour-by-hour
- Daily: Day-by-day analysis for week or month views
- Weekly: Weekly summaries for monthly or quarterly reports
- Monthly: Month-by-month trends for annual reviews
- Quarterly: High-level quarterly performance
- Yearly: Long-term trend analysis
Report Metrics
Advanced Reports display comprehensive metrics including:
Utilization Metrics
- Utilization %: Percentage of scheduled time actively producing
- Uptime: Total productive runtime
- Downtime: Total non-productive time
- Idle Time: Time between scheduled shifts or unassigned periods
Production Metrics
- Parts Produced: Total part count for the period
- Cycle Time: Actual average cycle time vs. target
- Production Rate: Parts per minute or hour
- OEE: Overall Equipment Effectiveness calculation
Time Breakdown
- Scheduled Time: Total time machines were expected to run
- Unscheduled Time: Time outside defined shifts
- Downtime by Category: Breakdown of downtime reasons
Performance Indicators
- Goal Achievement: Percentage of production goals met
- Trend Direction: Improving, declining, or stable performance
- Variance: Difference from targets or baselines
Common Use Cases
1. Monthly Executive Summary
Objective: Create a high-level performance report for management
Set date range
Select Last Month from the date range picker
Choose time interval
Set interval to Weekly to see 4-5 data points for the month
Select all machines (or by department)
Include all assets or filter by department for department-specific reports
Review key metrics
Focus on utilization %, total uptime/downtime, and parts produced
Export or screenshot
Export to CSV or take a screenshot for presentation slides
Result: Clean monthly summary showing weekly trends suitable for executive presentations
2. Shift Performance Comparison
Objective: Compare day shift vs. night shift performance
Set date range
Choose Last 2 Weeks or Last Month
Select time interval
Set to Daily to see day-by-day patterns
Run report for Day Shift
Filter by Day Shift and note the average utilization %
Run report for Night Shift
Change filter to Night Shift and compare results
Identify gaps
Look for significant differences in utilization, downtime, or production output
Result: Clear comparison showing which shift performs better and by how much
3. Department Benchmarking
Objective: Identify which department is most/least efficient
Set date range
Choose a consistent period (e.g., Last Quarter)
Set interval
Use Monthly to see consistent trends
Run reports for each department
Generate separate reports for each department
Compare metrics
Look at utilization %, downtime hours, and production output
Share best practices
Identify what top-performing departments are doing differently
Result: Ranked list of departments by performance with actionable insights
4. Improvement Initiative Tracking
Objective: Measure the impact of a process improvement or equipment upgrade
Define before period
Set date range for 4 weeks before the improvement
Run baseline report
Generate report and note average utilization and downtime
Define after period
Set date range for 4 weeks after the improvement
Run post-improvement report
Generate report with same filters and interval
Calculate impact
Compare utilization %, downtime reduction, and production increase
Result: Quantified ROI showing exactly how much the improvement helped
5. Specific Machine Deep Dive
Objective: Investigate a specific machine's performance over time
Select the machine
Filter to show only the machine in question
Set a long date range
Choose Last 3 Months or Last Quarter
Use Daily or Weekly interval
See trends without too much noise
Look for patterns
Identify recurring issues, degrading performance, or improvement trends
Cross-reference with downtimes
Use Downtimes page to see specific events during low-performance periods
Result: Complete performance history revealing patterns and root causes
Filtering Options Explained
Date Range Selection
Use the date picker to select a custom date range:
- Click the date range selector to open the calendar
- Choose start date and end date for your analysis period
- Apply the date range to filter your report data
This allows you to analyze any specific time period, from a single day to multiple years.
Time Interval Impact
The interval you choose dramatically affects how data is displayed:
| Interval | Best For | Data Points | Use Case |
|---|---|---|---|
| Hourly | Single day or shift | 8-24 per day | Detailed shift analysis |
| Daily | 1-4 weeks | 7-30 points | Weekly or monthly trends |
| Weekly | 1-6 months | 4-26 points | Monthly or quarterly reports |
| Monthly | 3-24 months | 3-24 points | Quarterly or annual reviews |
| Quarterly | 1-5 years | 4-20 points | Long-term strategic planning |
| Yearly | Multi-year | 2-10 points | Historical benchmarking |
Choose an interval that gives you 5-15 data points for easy visualization. Too few points hide trends; too many create noise.
Exporting Data
CSV Export
Click the CSV button to download report data:
- All visible metrics included
- Formatted for Excel or Google Sheets
- Preserves filters and date ranges
- Use for custom analysis or integration with other systems
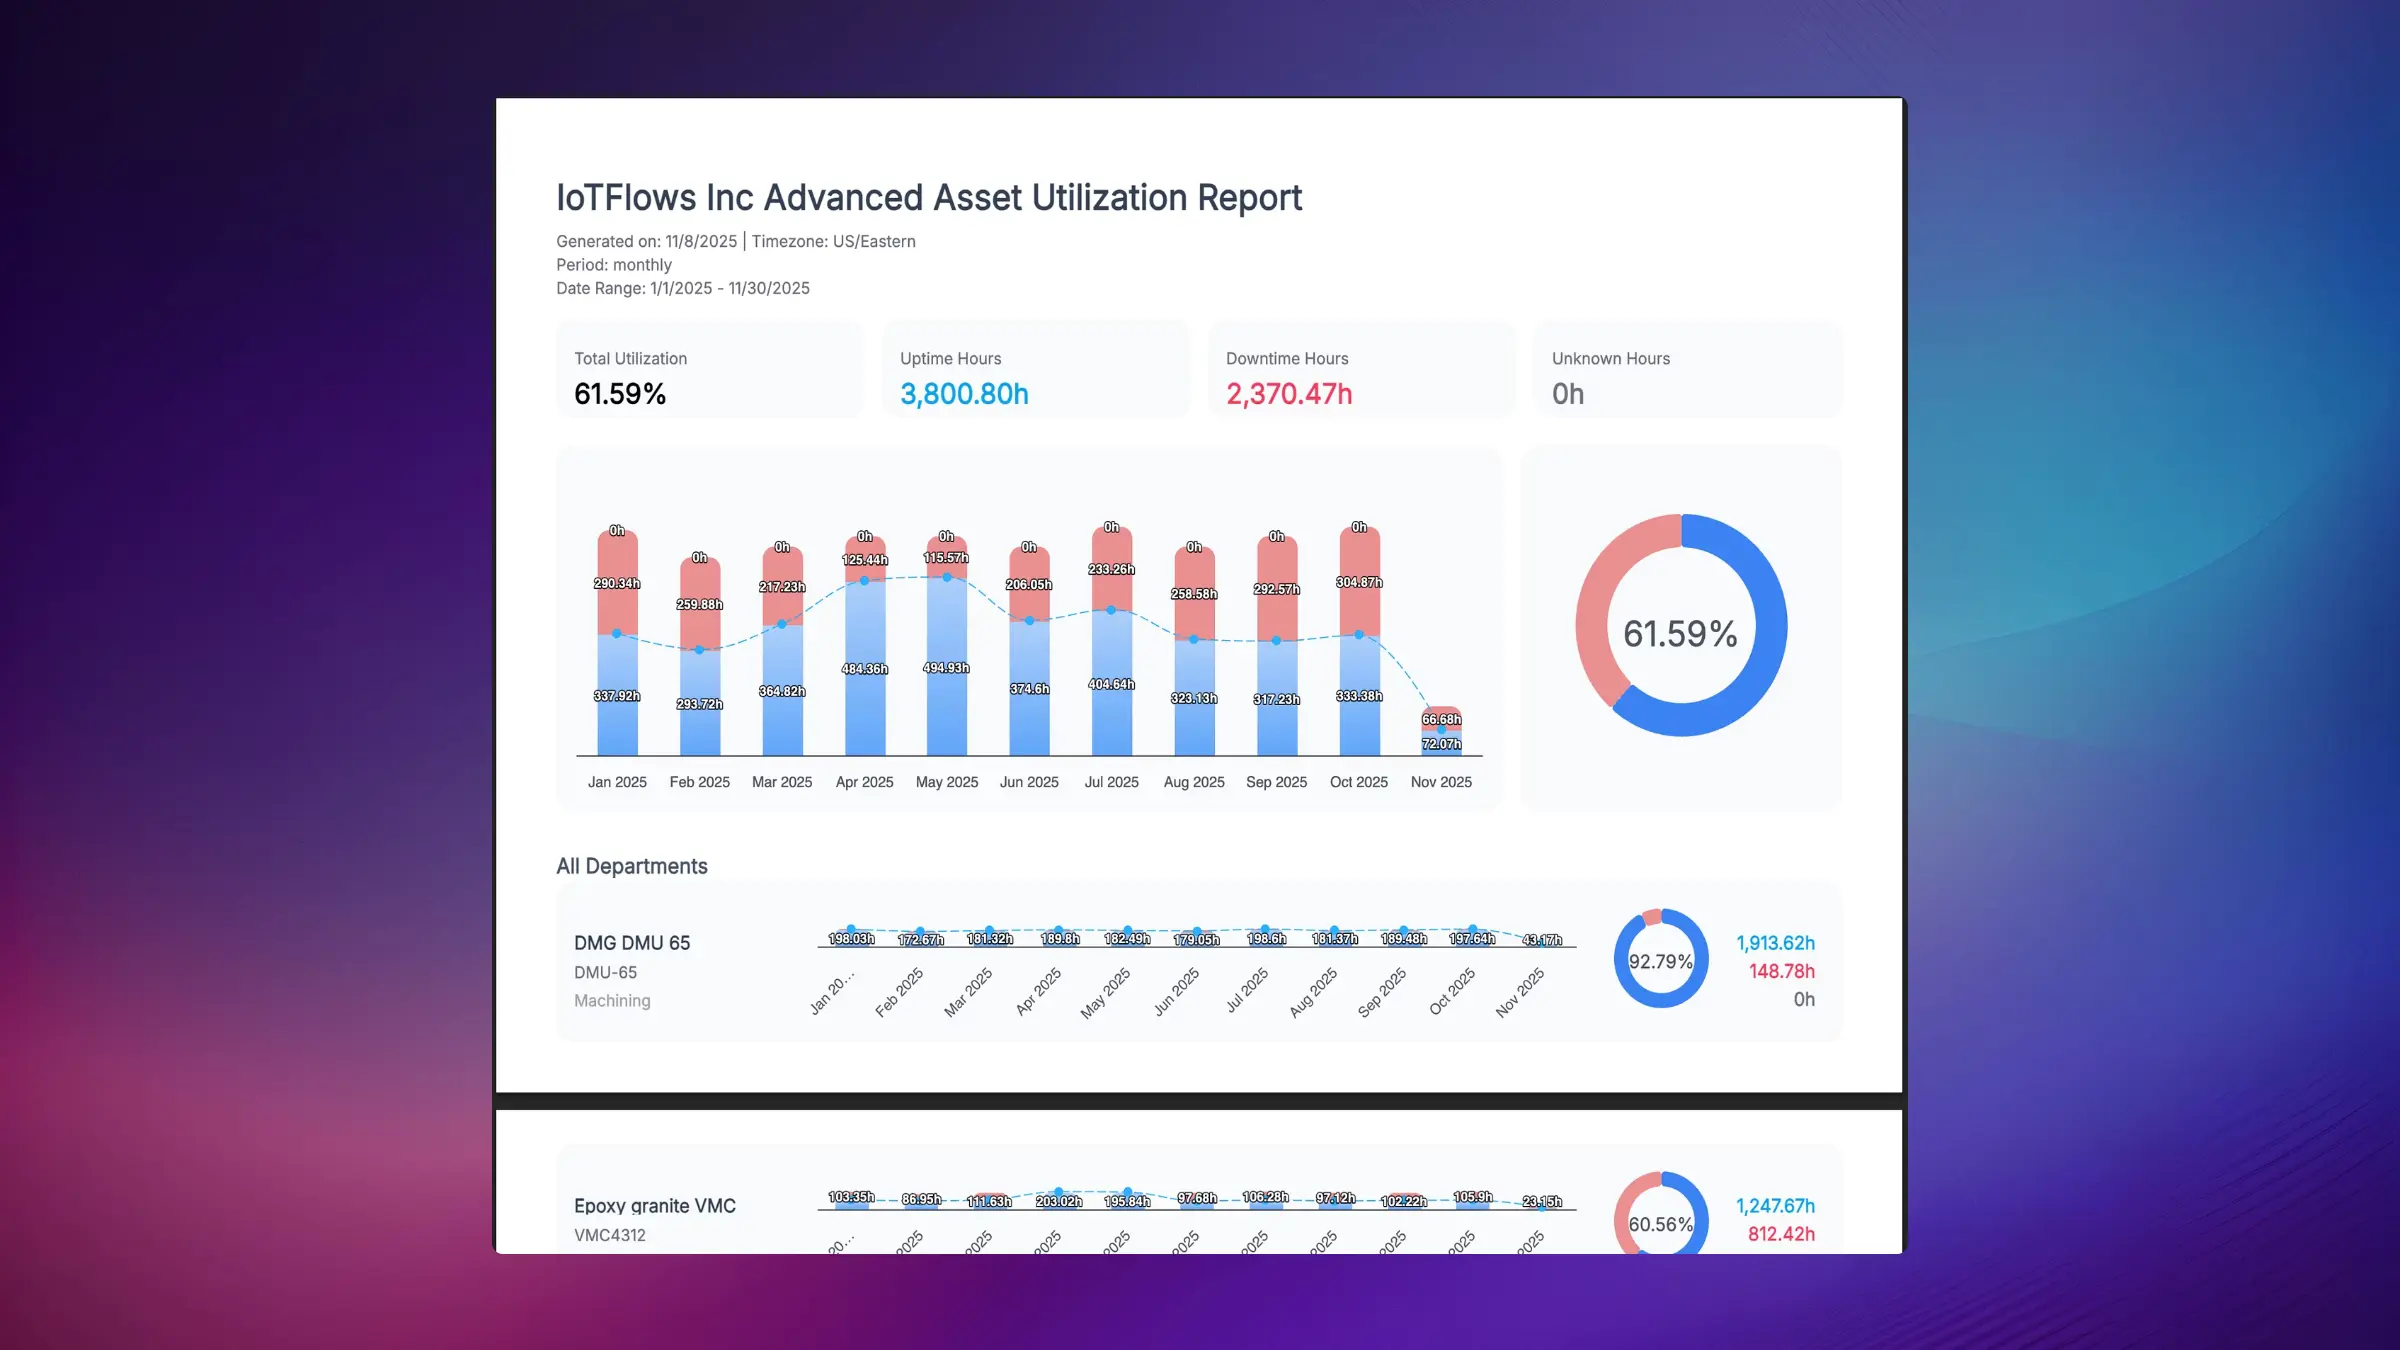
PDF Generation (if available)
Generate printer-friendly reports:
- Professional formatting
- Includes charts and summary tables
- Suitable for distribution to stakeholders
- Archival for compliance or records
Best Practices
1. Use Consistent Time Periods for Comparisons
When comparing performance (e.g., this month vs. last month), ensure:
- Same number of working days
- Same shift configuration
- Same machines included
- Account for holidays or plant shutdowns
2. Start Broad, Then Narrow
Begin with facility-wide reports, then drill down:
- All machines, monthly view → identify underperforming departments
- Department-level, weekly view → find specific problem machines
- Machine-level, daily view → pinpoint exact issues
3. Set a Regular Review Schedule
Establish recurring report reviews:
- Daily: Quick utilization check (Today, Hourly interval)
- Weekly: Team meeting report (Last 7 Days, Daily interval)
- Monthly: Management review (Last Month, Weekly interval)
- Quarterly: Strategic planning (Last Quarter, Monthly interval)
4. Bookmark Common Reports
If your platform supports it, save filter combinations for frequently-used reports to save time.
5. Combine with Other Tools
Advanced Reports answer "what" and "how much." Use other tools for deeper analysis:
- Downtimes page: Understand "why" performance was low
- Historical Production: Track specific part/operation trends
- Assets Overview: Real-time status and intervention
Interpreting Results
Identifying Trends
Improving Performance:
- Utilization % increasing over time
- Downtime hours decreasing
- Production output growing
- Action: Document what's working and maintain momentum
Declining Performance:
- Utilization % dropping over time
- Downtime hours increasing
- Production output falling
- Action: Investigate root causes immediately (aging equipment, operator turnover, process degradation)
Stable Performance:
- Consistent metrics across time periods
- Low variance between intervals
- Action: Good operational control, look for small optimization opportunities
High Variability:
- Large swings in utilization or output
- Inconsistent performance
- Action: Investigate causes of instability (unreliable equipment, inconsistent processes, training gaps)
Common Questions
Need help creating custom reports or interpreting results? Contact our support team at support@iotflows.com
Generate powerful downtime root cause analysis reports with advanced filtering and visualization options.
Enhance efficiency and accuracy with a smart, automated system that seamlessly tracks work sessions based on operator sign-ins.