

Historical Production
Analyze production trends over weeks and months with comprehensive historical views showing operation performance, throughput, and quality metrics.
Overview
The Historical Production page provides a powerful long-term view of your manufacturing output, allowing you to analyze production trends across weeks, months, quarters, and years. This page helps you identify patterns, track improvement initiatives, compare performance across time periods, and make data-driven decisions for capacity planning and process optimization.
Perfect for:
- Tracking production trends over extended periods
- Comparing week-over-week or month-over-month performance
- Evaluating the success of continuous improvement projects
- Planning capacity and workforce needs based on historical data
- Identifying seasonal or recurring production patterns
- Benchmarking current performance against historical baselines
What You Can See
The Historical Production page displays production data organized by operation/part with the following information:
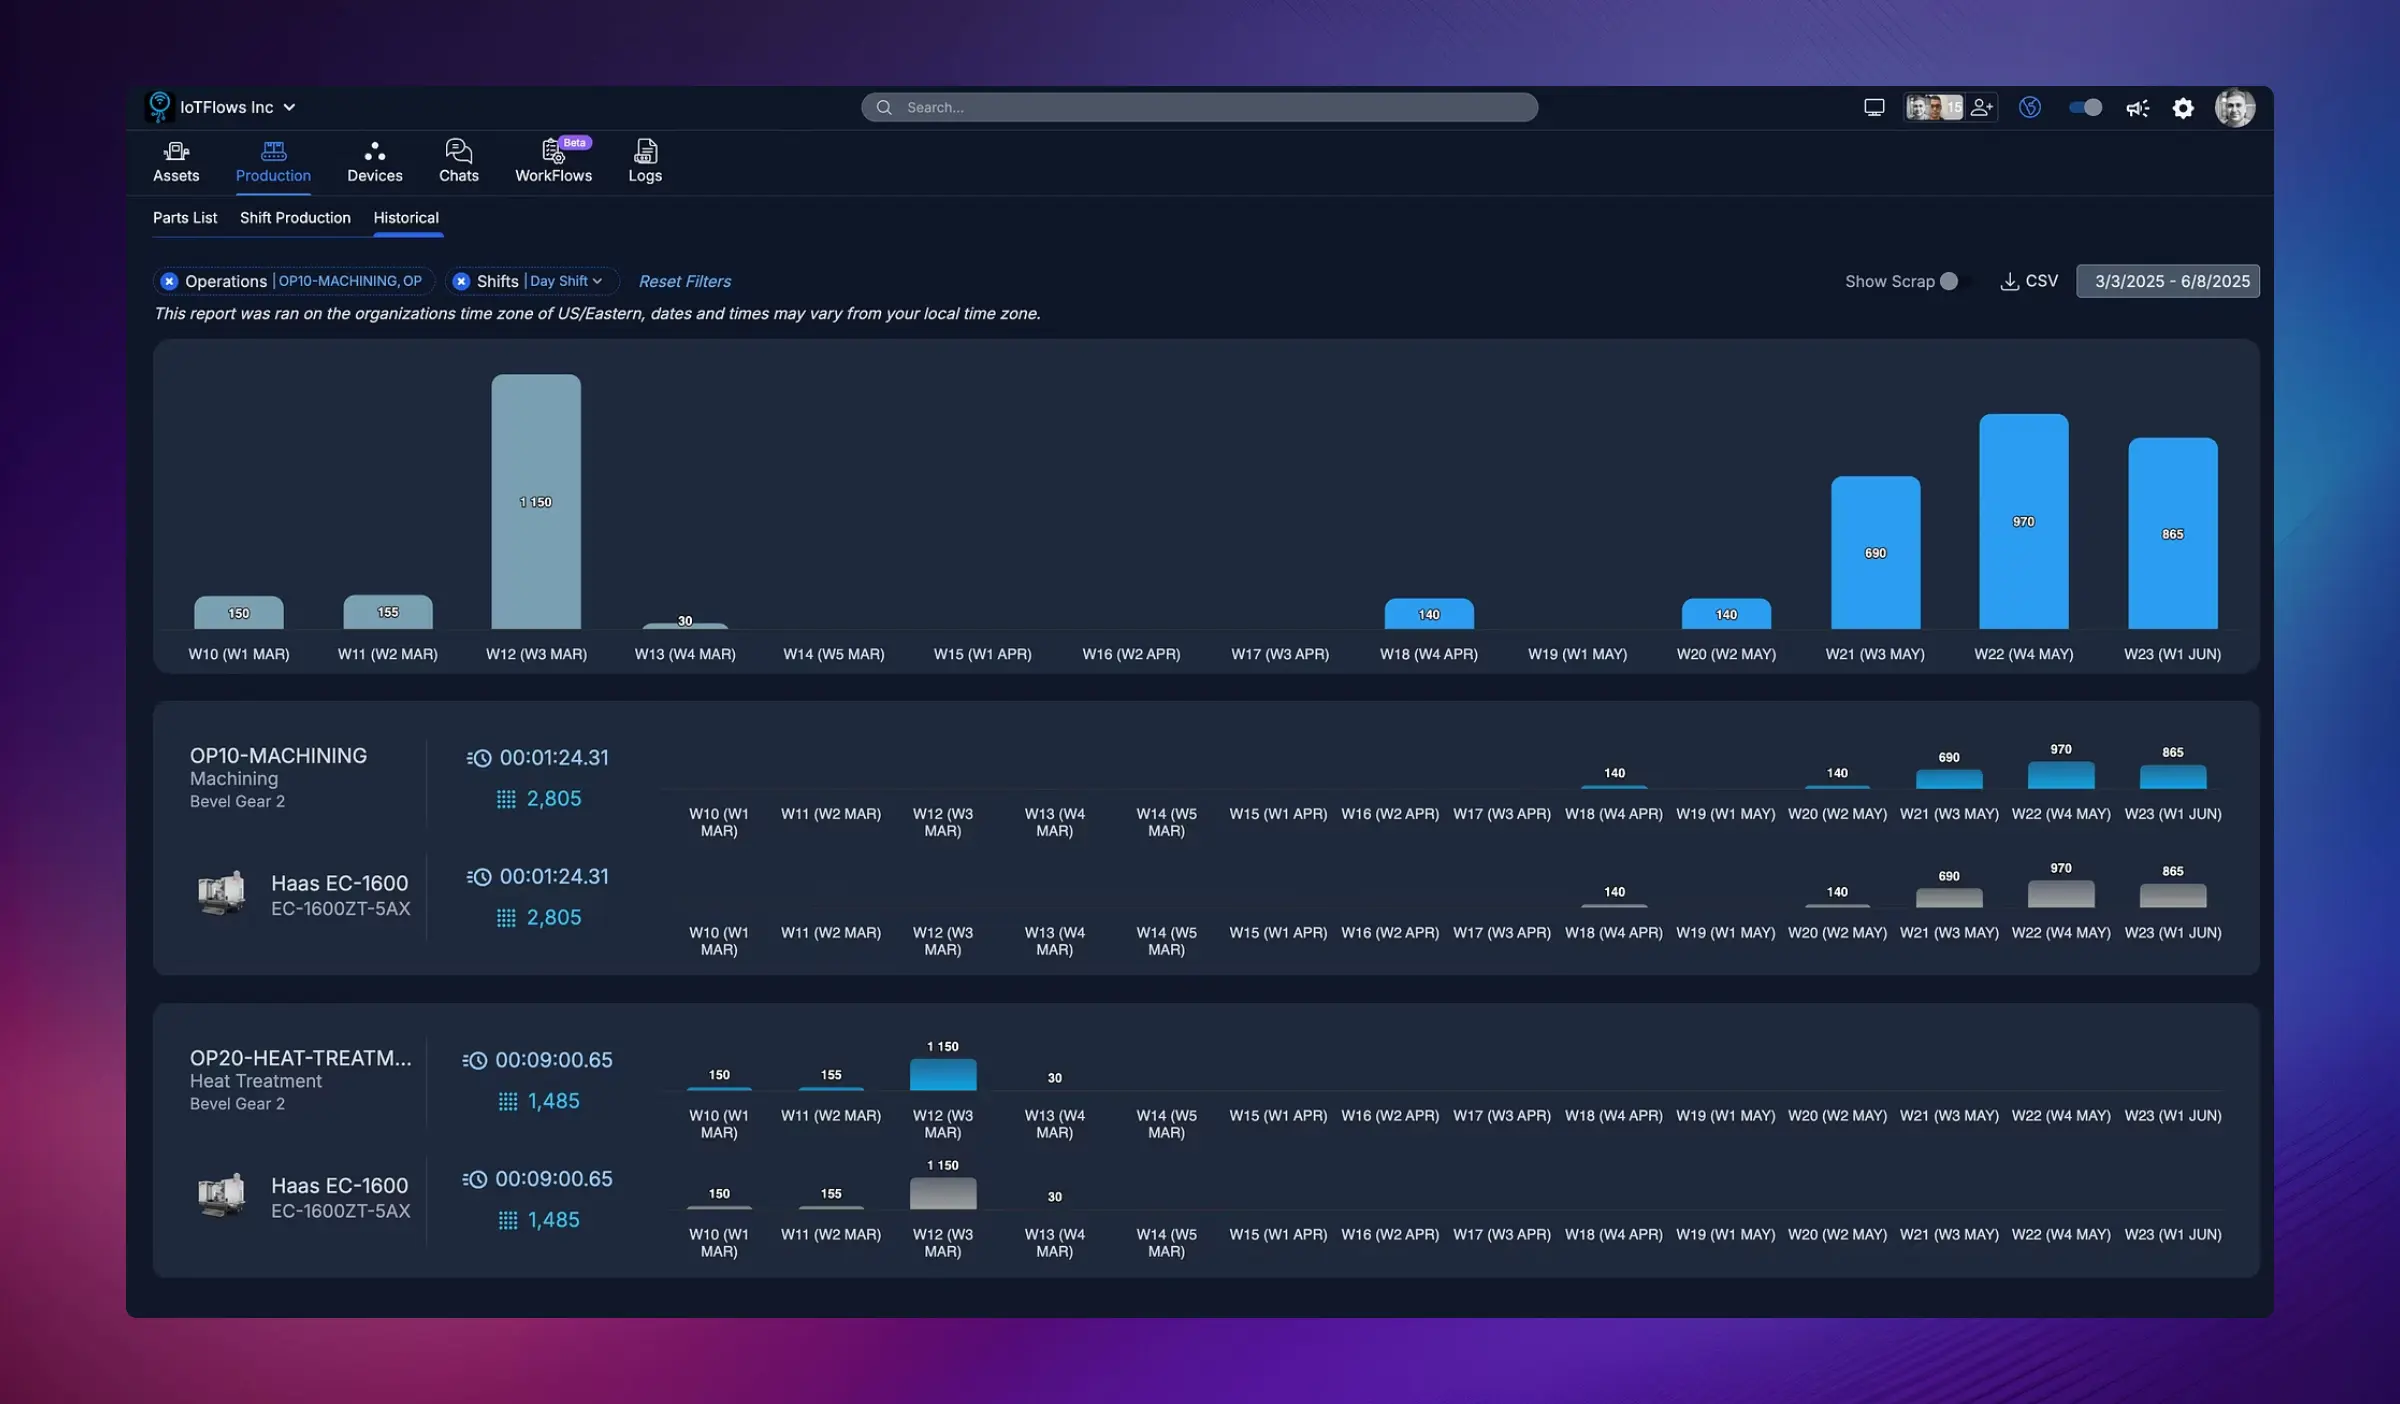
Operation/Part Summary
- Operation Name and Part: The specific operation or part being tracked (e.g., "OP10-MACHINING", "Haas EC-1600")
- Total Parts Produced: Cumulative count for the selected time period
- Operation Details: Bevel gear types, machine models, or other identifying information
Weekly/Monthly Production Bars
Visual bar chart showing production quantities for each week or month in the selected date range:
- Height of bars indicates production volume
- Hover over bars to see exact part counts for that period
- Compare bars side-by-side to identify trends (increasing, decreasing, or stable production)
Time Period Labels
Clear labeling showing:
- Week numbers (e.g., "W10 (W1 MAR)", "W18 (W4 APR)")
- Month names for monthly views
- Quarters for quarterly analysis
- Years for annual comparisons
Filtering and Date Range
Choose custom date ranges to analyze:
- Last 4 weeks
- Last 3 months
- Last quarter
- Last year
- Custom date range (select specific start and end dates)
Filtering and Options
Filter by Operations
Select specific operations or parts to focus your historical analysis:
- Single operation to track one part's performance over time
- Multiple operations to compare performance side-by-side
- All operations for a comprehensive facility-wide view
Filter by Shifts
Choose which shifts to include in historical data:
- Day Shift only
- Night Shift only
- Weekend Shift
- All Shifts combined
Group By
Organize historical data by:
- Operation: Show each operation as a separate row
- Part: Group all operations producing the same part
- Machine: View production history by specific equipment
Sort Options
Sort historical data by:
- Total Production: Highest to lowest output
- Operation Name: Alphabetical order
- Trend: Operations with improving vs. declining output
Export Data
Download historical production data as CSV for:
- Custom analysis in Excel or analytics tools
- Executive reporting
- ERP system integration
- Long-term archival
Click the CSV button in the top-right corner to export the visible data.
Show Scrap Toggle
Enable the Show Scrap option to include rejected/bad parts in the visualization, allowing you to track quality trends over time.
Use Cases
1. Track Continuous Improvement Initiatives
When you implement process changes, use Historical Production to measure their impact:
- Compare production before and after the change
- Quantify improvements in throughput
- Validate ROI on improvement investments
- Share success stories with stakeholders
Example: After installing new tooling on a CNC machine, compare production for the 4 weeks before vs. 4 weeks after to measure the productivity gain.
2. Identify Seasonal Patterns
Analyze production across months and quarters to spot seasonal trends:
- Higher demand during specific months
- Staffing needs that vary by season
- Equipment utilization patterns
- Supply chain timing
Example: Discover that production drops every December due to holiday shutdowns and plan workforce reductions accordingly.
3. Capacity Planning
Use historical data to forecast future capacity needs:
- Determine if current equipment can handle projected demand
- Identify when additional machines or shifts are needed
- Plan capital expenditures based on growth trends
- Optimize workforce scheduling
Example: Historical data shows consistent 10% quarterly growth; use this trend to justify purchasing an additional machine before capacity is constrained.
4. Benchmarking and Goal Setting
Establish realistic production goals based on historical performance:
- Set targets that challenge teams while remaining achievable
- Identify "best week" performance and work toward making it consistent
- Compare current performance against historical peaks
Example: Historical data shows your best month ever was 5,000 units. Set a new goal to achieve 5,000+ units consistently.
5. Root Cause Analysis for Declines
When production drops, Historical Production helps you pinpoint when the decline started:
- Narrow the timeline for investigation
- Correlate production drops with other events (maintenance, personnel changes, supplier issues)
- Identify gradual degradation vs. sudden drops
Example: Notice production declining gradually over 6 weeks, investigate and discover worn tooling that needed replacement.
6. Compare Shift Performance
Analyze production trends by shift to identify training needs or operational issues:
- Compare day shift vs. night shift output over months
- Identify if one shift consistently underperforms
- Evaluate the impact of operator changes or training programs
Understanding the Visualizations
Bar Chart Interpretation
- Tall bars: High production weeks/months (good performance)
- Short bars: Low production periods (investigate why)
- Increasing trend: Production improving over time (continuous improvement working)
- Decreasing trend: Production declining (requires attention and root cause analysis)
- Consistent bars: Stable, predictable production (good operational control)
- Highly variable bars: Inconsistent production (indicates instability or external factors)
Missing Data
If no bar appears for a time period, it means:
- No production occurred during that period
- The operation wasn't yet set up in IoTFlows
- The machine was offline or disconnected
Best Practices
1. Review Historical Trends Regularly
Don't just focus on daily or shift-level performance. Set aside time monthly or quarterly to review long-term trends and identify strategic improvement opportunities.
2. Combine with Downtime Analysis
When production declines in historical data:
- Note the time period of the decline
- Navigate to the Downtimes page
- Filter by the same date range
- Identify root causes (excessive downtime, quality issues, etc.)
3. Document Changes and Events
Keep a log of significant events (equipment changes, process improvements, operator training, etc.) so you can correlate them with production trend changes visible in Historical Production.
4. Share Insights with Stakeholders
Use historical production charts in management reviews, team meetings, and improvement project presentations to demonstrate progress and justify investments.
5. Set Baselines for New Operations
When starting a new operation or part, establish a baseline by tracking production for the first 4-8 weeks. Use this as your reference point for future improvement.
Have questions about interpreting historical trends or improving production consistency? Contact our support team at support@iotflows.com