

Shift Production
Track real-time production progress against shift goals with detailed operation-level metrics, quality tracking, and hourly production rates.
Overview
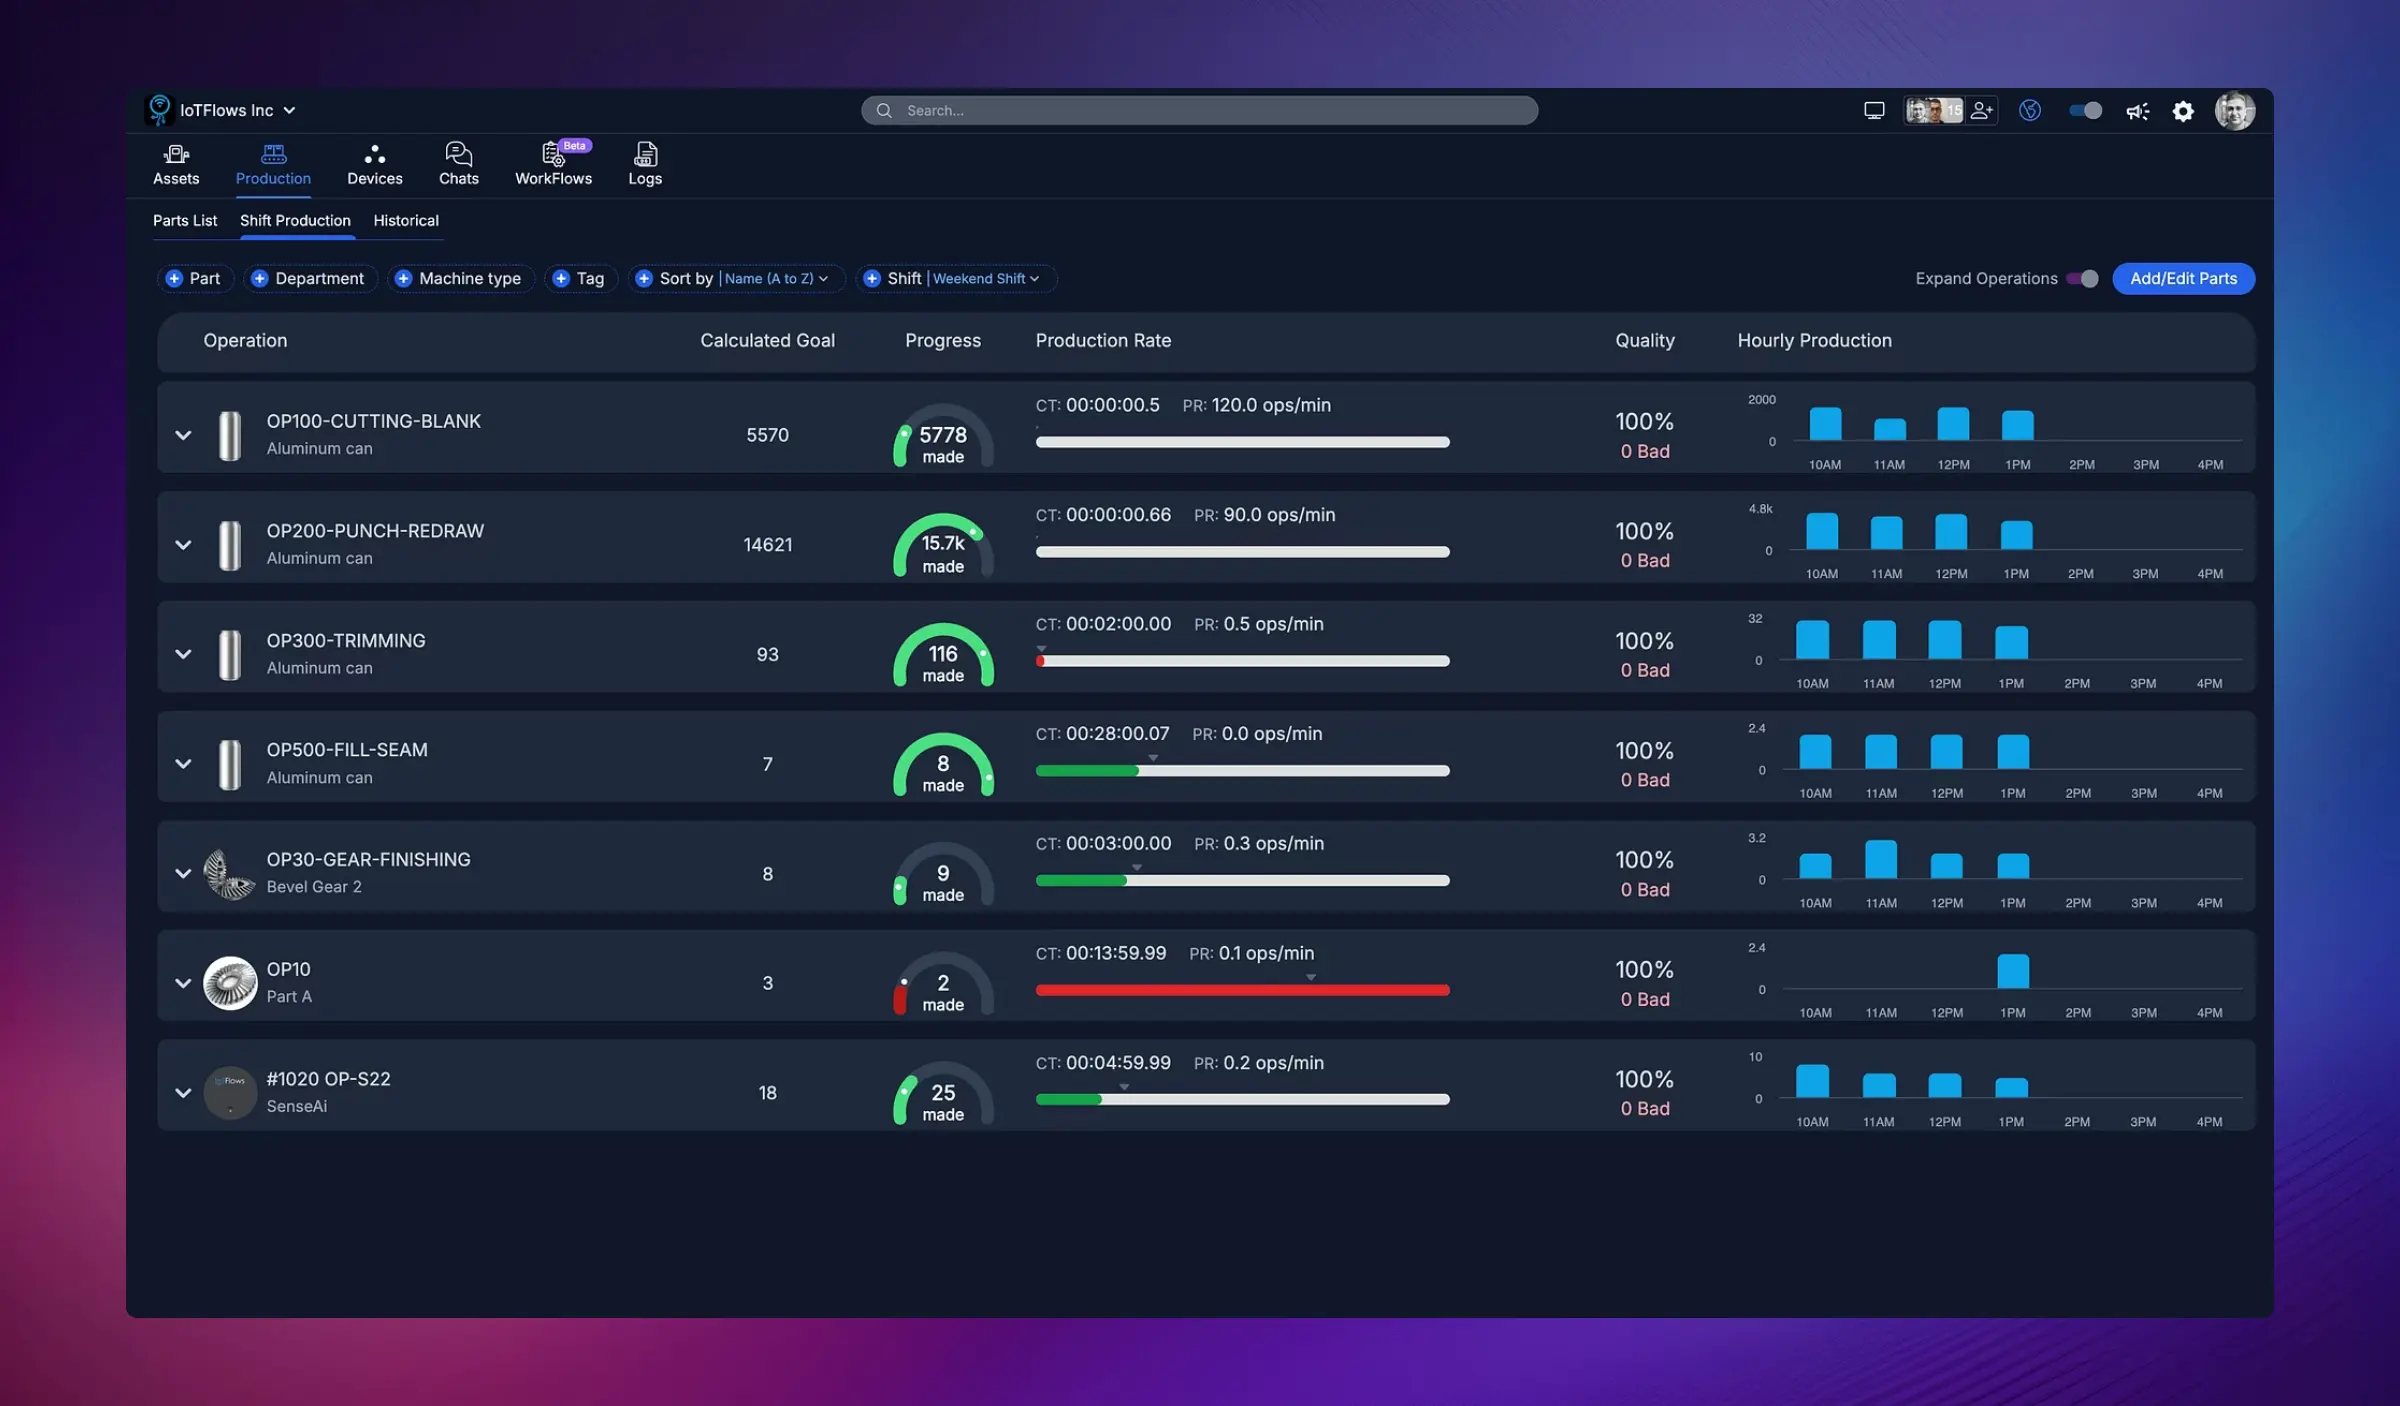
The Shift Production page provides real-time visibility into production output for the current or selected shift. This powerful view shows exactly what's being produced, how much progress has been made toward goals, production rates, quality metrics, and hourly production trends — all organized by operation or part number.
Perfect for:
- Monitoring shift progress in real-time
- Ensuring production targets are met
- Identifying slow or problematic operations
- Tracking quality and reject rates
- Comparing production rates against expected cycle times
- Making data-driven decisions during the shift
What You Can See
The Shift Production page displays a comprehensive view of every operation running during the selected shift, including:
Operation/Part Information
- Operation Name: The specific operation or part being produced (e.g., "OP100-CUTTING-BLANK", "OP30-GEAR-FINISHING")
- Part/Material: The part number or material being processed (e.g., "Aluminum can", "Bevel Gear 2")
- Machine/Asset: Which machine or device is producing this operation
Production Goals
- Calculated Goal: Target quantity to produce during the shift based on cycle time and shift duration
- Progress Indicator: Visual gauge showing actual production vs. goal with real-time percentage
Color Coding:
- Green: Meeting or exceeding goal (on track or ahead)
- Red: Significantly behind goal (requires attention)
- Orange/Yellow: Slightly behind but recoverable
Cycle Time and Production Rate
- CT (Cycle Time): Expected time per piece (e.g., "00:00:00.5" = 0.5 seconds per part)
- PR (Production Rate): Target production rate in operations per minute (e.g., "120.0 ops/min")
Actual Performance
- Actual Cycle Time: Real measured cycle time from the current shift
- Actual Production Rate: Real measured production rate
This comparison helps you identify when machines are running slower than expected, indicating potential issues with tooling, materials, or setup.
Quality Metrics
- Quality Percentage: Good parts produced vs. total parts (e.g., "100%" = no rejects)
- Bad Parts Count: Number of rejected or scrapped parts (e.g., "0 Bad")
Hourly Production Chart
Each operation row includes a bar chart showing production output hour by hour throughout the shift:
- Visualize production peaks and valleys
- Identify periods of slow production or stoppages
- See exactly when production occurred
- Monitor consistency across the shift
Filtering and Options
Filter by Part
Use the Part filter to show only operations producing a specific part number or part family.
Filter by Department
Select a department to view production only for machines in that area.
Filter by Machine Type
Focus on specific types of equipment (e.g., CNC machines, assembly stations, packaging lines).
Filter by Tag
Use custom tags to group related operations or machines.
Sort Options
Sort operations by:
- Name (A to Z): Alphabetical by operation name
- Progress: Show operations furthest behind goal first
- Production Rate: Identify slowest operations
- Quality: Highlight operations with quality issues
Shift Selection
Choose which shift to view:
- Current shift (default when opened)
- Any past shift to analyze historical performance
Expand Operations
Click the arrow next to an operation to expand and see:
- Detailed production timeline
- Individual downtime events during the shift
- Additional performance metrics
Export Data
Download shift production data as CSV for further analysis or reporting using the CSV button in the top-right corner.
Understanding Production Goals
How Goals Are Calculated
IoTFlows automatically calculates production goals based on:
- Shift Duration: Total scheduled time for the shift
- Expected Cycle Time: Target time per part (set in the Parts List)
- Expected Downtime: Historical average downtime for the operation/machine
Formula:
Goal = (Shift Duration - Expected Downtime) / Cycle Time
Adjusting Goals
If calculated goals don't match your targets, you can:
- Navigate to the Parts List page
- Edit the operation's cycle time or expected rate
- Goals will recalculate automatically for future shifts
Manual Goal Override
For special circumstances (rush orders, reduced capacity, etc.), you can manually set custom goals for specific operations.
Use Cases
1. Real-Time Shift Monitoring
Keep the Shift Production page open on a supervisor's screen or TV display to monitor progress throughout the shift. Immediately identify when operations fall behind and intervene before the end of the shift.
2. End-of-Shift Review
At the end of each shift, review Shift Production to:
- Confirm all goals were met
- Document any shortfalls and reasons
- Identify operations that consistently underperform
- Recognize operators or machines that exceeded targets
3. Production Planning
Use historical shift production data to:
- Estimate completion times for orders
- Plan workforce assignments
- Schedule preventive maintenance during low-impact periods
- Balance production loads across shifts
4. Quality Tracking
Monitor quality percentages to:
- Identify operations with high scrap rates
- Trigger quality investigations when thresholds are exceeded
- Track quality improvement initiatives
- Compare quality across shifts or operators
5. Continuous Improvement
Analyze hourly production charts to:
- Identify patterns (e.g., slow production at shift start)
- Optimize break schedules to minimize disruption
- Evaluate the impact of process changes
- Benchmark best practices from high-performing periods
Color-Coded Production Status
The progress gauges use intuitive color coding to help you quickly identify issues:
Green
- Meaning: Operation is on track or ahead of schedule
- Action: Continue normal operations
Orange/Yellow
- Meaning: Operation is slightly behind but may still meet the goal if production pace improves
- Action: Monitor closely, consider light intervention (remove small obstacles, check for minor issues)
Red
- Meaning: Operation is significantly behind goal and unlikely to meet target without intervention
- Action: Immediate attention required — identify root cause (downtime, slow cycle time, quality issues) and take corrective action
Best Practices
1. Monitor Proactively
Don't wait until the end of the shift to discover you missed a goal. Check Shift Production every 1-2 hours to stay ahead of problems.
2. Set Realistic Goals
Overly aggressive goals lead to frustration and burnout. Use historical data to set challenging but achievable targets.
3. Investigate Red Status Immediately
When an operation shows red, drill down to understand why:
- Check the Downtimes tab for extended stoppages
- Review cycle time to see if the machine is running slow
- Look at quality metrics to identify scrap issues
4. Celebrate Success
When teams consistently meet or exceed goals, recognize and reward their performance. Positive reinforcement drives sustained improvement.
5. Track Trends Over Time
Don't just focus on a single shift. Use the Historical Production page to track multi-shift and multi-week trends.
Have questions about setting production goals or interpreting shift data? Contact our support team at support@iotflows.com
Configure parts, operations, production algorithms, cycle times, and downtime filters for accurate production tracking and analysis.
Analyze production trends over weeks and months with comprehensive historical views showing operation performance, throughput, and quality metrics.