

Canvas - Visual Production Floor Mapping
Create custom visual layouts of your production floor with interactive diagrams showing machine relationships, real-time status, and production flows.
Overview
The Canvas feature transforms your production data into an intuitive visual representation of your manufacturing floor. Instead of viewing machines in a list, Canvas allows you to create custom diagrams that mirror your actual facility layout, showing how machines, production lines, and equipment relate to each other in real-time.
Perfect for:
- Visualizing production line flows
- Monitoring department layouts at a glance
- Sharing shop floor status on TV displays
- Identifying bottlenecks in multi-stage processes
- Onboarding new team members who need to understand facility layout
What is Canvas?
Canvas is an interactive diagram builder that lets you:
- Drag and drop machines, equipment, and devices onto a visual workspace
- Arrange them to match your physical facility layout
- Connect related assets to show production flows
- Group machines by department, line, or process
- Monitor real-time status with color-coded indicators
- View live performance data directly on the visual layout
Think of Canvas as your digital twin of the production floor – a live, visual representation that updates in real-time as machines run, stop, or change states.
Creating Your First Canvas Layout
1. Access Canvas Mode
From the Assets Tab, click on the Canvas (NEW) sub-tab to enter the Canvas editor.
2. Build Your Layout
Use the toolbar at the bottom of the screen to add elements:
Available Tools:
- Select Tool (Cursor icon): Move, resize, and select objects
- Draw Connection (Arrow icon): Connect machines to show process flows
- Zoom In/Out (Magnifying glass): Adjust view scale
- Add Shape (Circle, Star, Square icons): Add visual containers or groupings
- Add Frame (Frame icon): Create sections or department boundaries
- Add Text (T icon): Label areas, departments, or processes
- Delete (Trash icon): Remove selected objects
3. Add Machines to Your Canvas
- Drag machines from the left sidebar onto the canvas workspace
- Position them to match your physical facility layout
- Resize machine cards as needed
4. Create Visual Groupings
Use frames and shapes to:
- Outline departments or production cells
- Highlight critical equipment
- Show process boundaries
- Create visual hierarchies
5. Connect Your Process Flow
Use the arrow tool to draw connections showing:
- Material flow between machines
- Multi-stage production processes
- Dependencies between equipment
- Finished goods paths
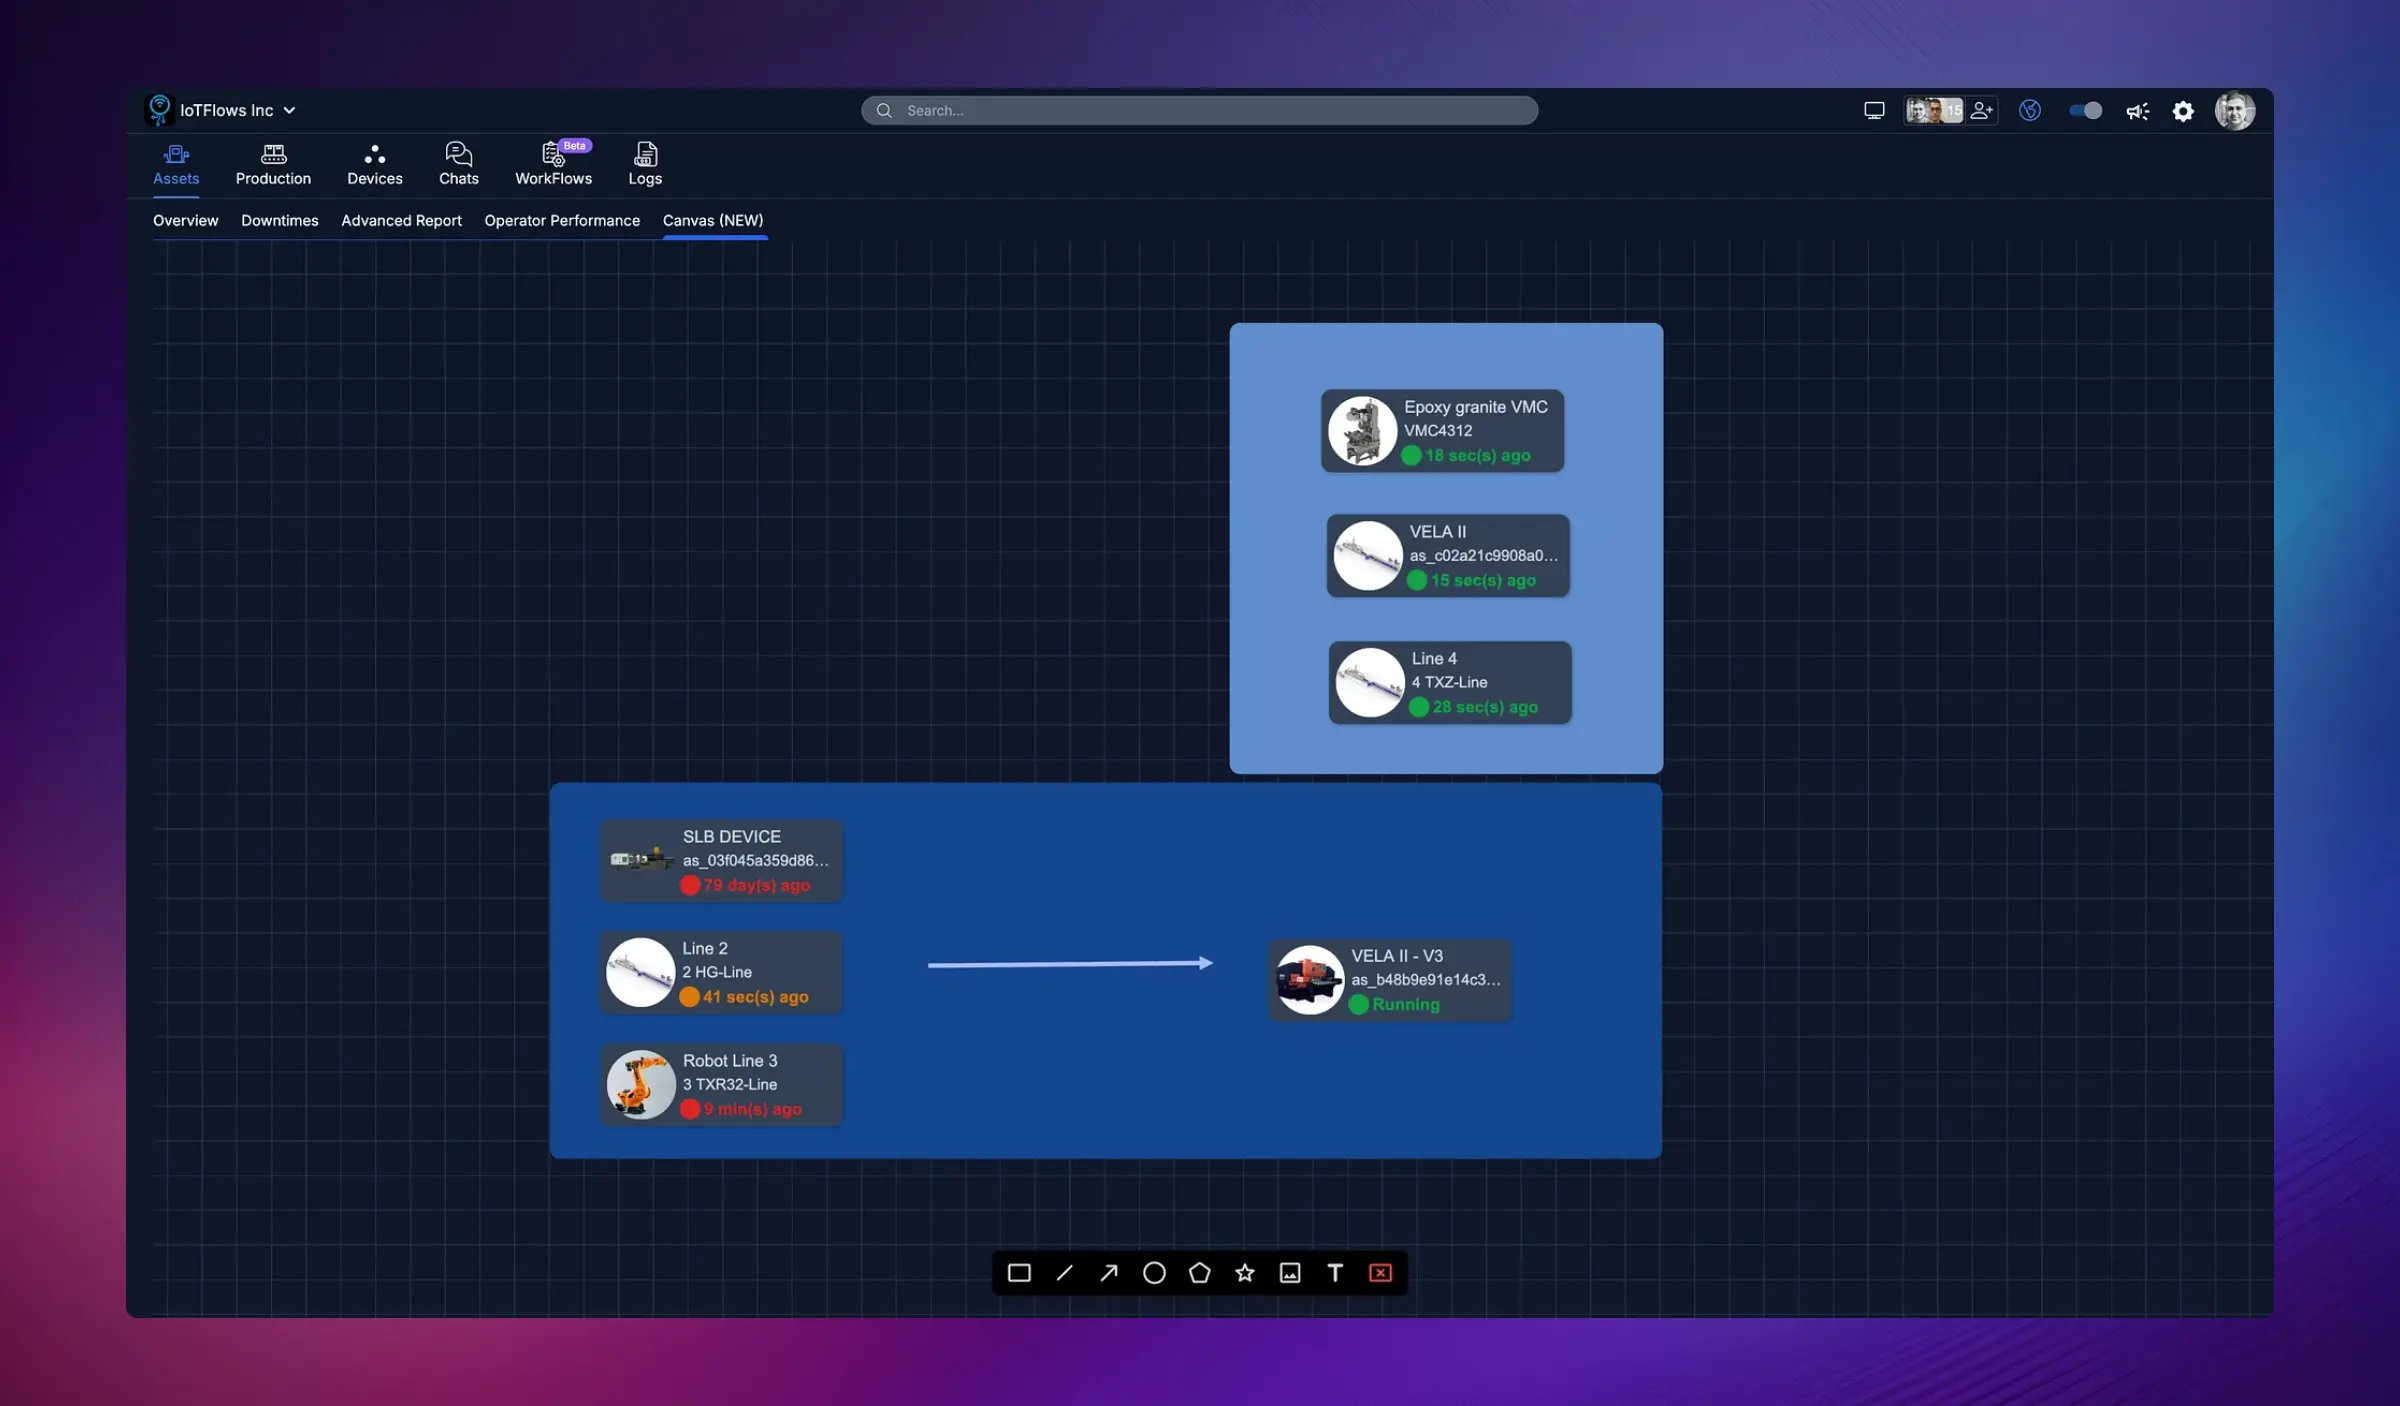
Real-Time Machine Status
Each machine displayed on the Canvas shows:
- Machine name and model/ID
- Live status indicator:
- Green: Currently running
- Red: Stopped or down
- Orange: Idle or transitioning
- Time since last state change (e.g., "10 sec(s) ago", "2h 15m ago")
- WiFi/Connectivity icon indicating device connection status
This real-time feedback makes Canvas ideal for monitoring production flow at a glance without needing to dig into detailed reports.
Use Cases for Canvas
1. Production Line Visualization
Create end-to-end views of multi-stage processes:
- Map raw material entry through finished goods
- Identify where bottlenecks occur in the flow
- Monitor line balance and throughput rates
Example: A machining line with roughing → semi-finishing → finishing stations connected in sequence
2. Department Dashboards
Build dedicated Canvas views for each department:
- CNC Department with all milling and turning centers
- Assembly Department showing workstations and inspection
- Packaging Line with conveyors and palletizers
3. Facility-Wide Overview
Create a master Canvas showing your entire plant:
- Group machines by production cell
- Show material handling equipment
- Display critical shared resources (e.g., air compressors, chillers)
4. TV Display Mode
Design simplified Canvas layouts optimized for large screen displays:
- Focus on key machines and KPIs
- Use the TV sharing feature to broadcast to shop floor monitors
- Provide operators with instant visibility into line status
5. Training and Onboarding
Use Canvas to help new employees understand:
- Physical facility layout
- Production process flows
- Equipment naming conventions
- Department boundaries and responsibilities
Best Practices for Canvas Design
Keep It Simple
Avoid cluttering your Canvas with too many elements. Create multiple Canvas views for different purposes rather than one overly complex layout.
Mirror Physical Reality
Arrange machines to match your actual facility layout. This makes it intuitive for operators and managers to understand what they're viewing.
Use Color and Grouping
Leverage frames and shapes to visually separate:
- Different departments (use different frame colors)
- Production cells or work centers
- Support equipment vs. production machines
Label Everything
Add text labels for:
- Department names
- Production line identifiers
- Special equipment or stations
- Material flow direction
Update as You Grow
As you add new machines or reconfigure your layout, keep your Canvas views up to date. An outdated Canvas can cause confusion.
Sharing Canvas to TV Displays
Canvas views are perfect for displaying on large monitors or TV screens throughout your facility:
- Design a Canvas layout optimized for the display location
- Click the TV icon in the top-right corner
- Select the Chromecast device assigned to your organization
- The Canvas will appear on the TV in real-time with live status updates
Operators, supervisors, and visitors can see the current production status at a glance without needing computer access.
Learn more: TV Screen Sharing
Editing and Managing Canvas Layouts
Saving Your Canvas
Changes to your Canvas are automatically saved as you work. No need to manually save your layout.
Creating Multiple Canvas Views
You can create as many Canvas layouts as needed:
- One per department
- One per shift (showing relevant machines for each shift)
- One for management overview
- One for shop floor displays
Deleting Elements
Select any object (machine, shape, text, connection) and click the trash icon to remove it.
Reordering and Layering
Objects can be moved forward or backward in the visual stack. Right-click on an object to access layering options (if available).
Canvas vs. Assets Overview
When to use Canvas:
- You want a visual representation of your facility
- You're displaying status on a TV for shop floor visibility
- You're explaining production flows to stakeholders
- You need to see process sequences at a glance
When to use Assets Overview:
- You need detailed performance metrics and timelines
- You're analyzing specific downtime events
- You want to sort and filter machines by various criteria
- You need to see utilization percentages and production rates
Both views are complementary – use Canvas for visual monitoring and Assets Overview for detailed analytics.
Need help designing your Canvas layout or have questions about best practices? Contact our support team at support@iotflows.com
Enhance efficiency and accuracy with a smart, automated system that seamlessly tracks work sessions based on operator sign-ins.
Learn how to assign a device to a specific machine for dedicated operator use.