

Downtimes
Generate powerful downtime root cause analysis reports with advanced filtering and visualization options.
Overview
The Downtimes page provides a comprehensive root cause analysis tool designed to help you understand, track, and eliminate production losses. This powerful reporting interface combines advanced filtering capabilities with intuitive visualizations to identify the most critical downtime issues affecting your operations.
With the Downtimes report, you can:
- Generate detailed root cause analysis based on multiple filter criteria
- Identify the most impactful downtime reasons using Pareto analysis
- Track how downtime patterns change over time
- Analyze downtime distribution across machines, departments, and shifts
- Make data-driven decisions to improve overall equipment effectiveness (OEE)
Filter and Report Options
Machine & Department Selection
Filter the report to analyze specific machines or entire departments, giving you flexibility to focus on particular areas of your production floor or view organization-wide performance.
Shift Filtering
Select specific shifts to identify patterns that may be shift-dependent or compare performance across different work periods. This helps you understand if certain issues are related to specific teams or times of day.
Categories (Downtime Reason Codes)
Filter by downtime categories based on severity levels and reason codes:
- Severity Levels: Focus on critical issues by filtering for High, Medium, or Low severity downtimes
- Reason Codes: Select specific downtime reasons such as Mechanical Issues, Operator Stopped, Tissue Jam, Foil Change, etc.
- View all active reason codes in your organization's classification system
Sort Options
Sort downtime events by various criteria including:
- Date (Newest to Oldest or Oldest to Newest)
- Duration (Highest to Lowest)
- Other custom sorting options
This helps you quickly identify the most time-consuming or recent issues.
Date Range & Time Intervals
- Date Filter: Select custom date ranges to analyze specific time periods
- Intervals: View downtime trends across different time horizons:
- Days
- Weeks
- Months
- Quarters
- Years
Only with Notes Filter
Toggle this option to display only downtime events that include operator notes, allowing you to focus on events with detailed context and explanations.
Visualizations
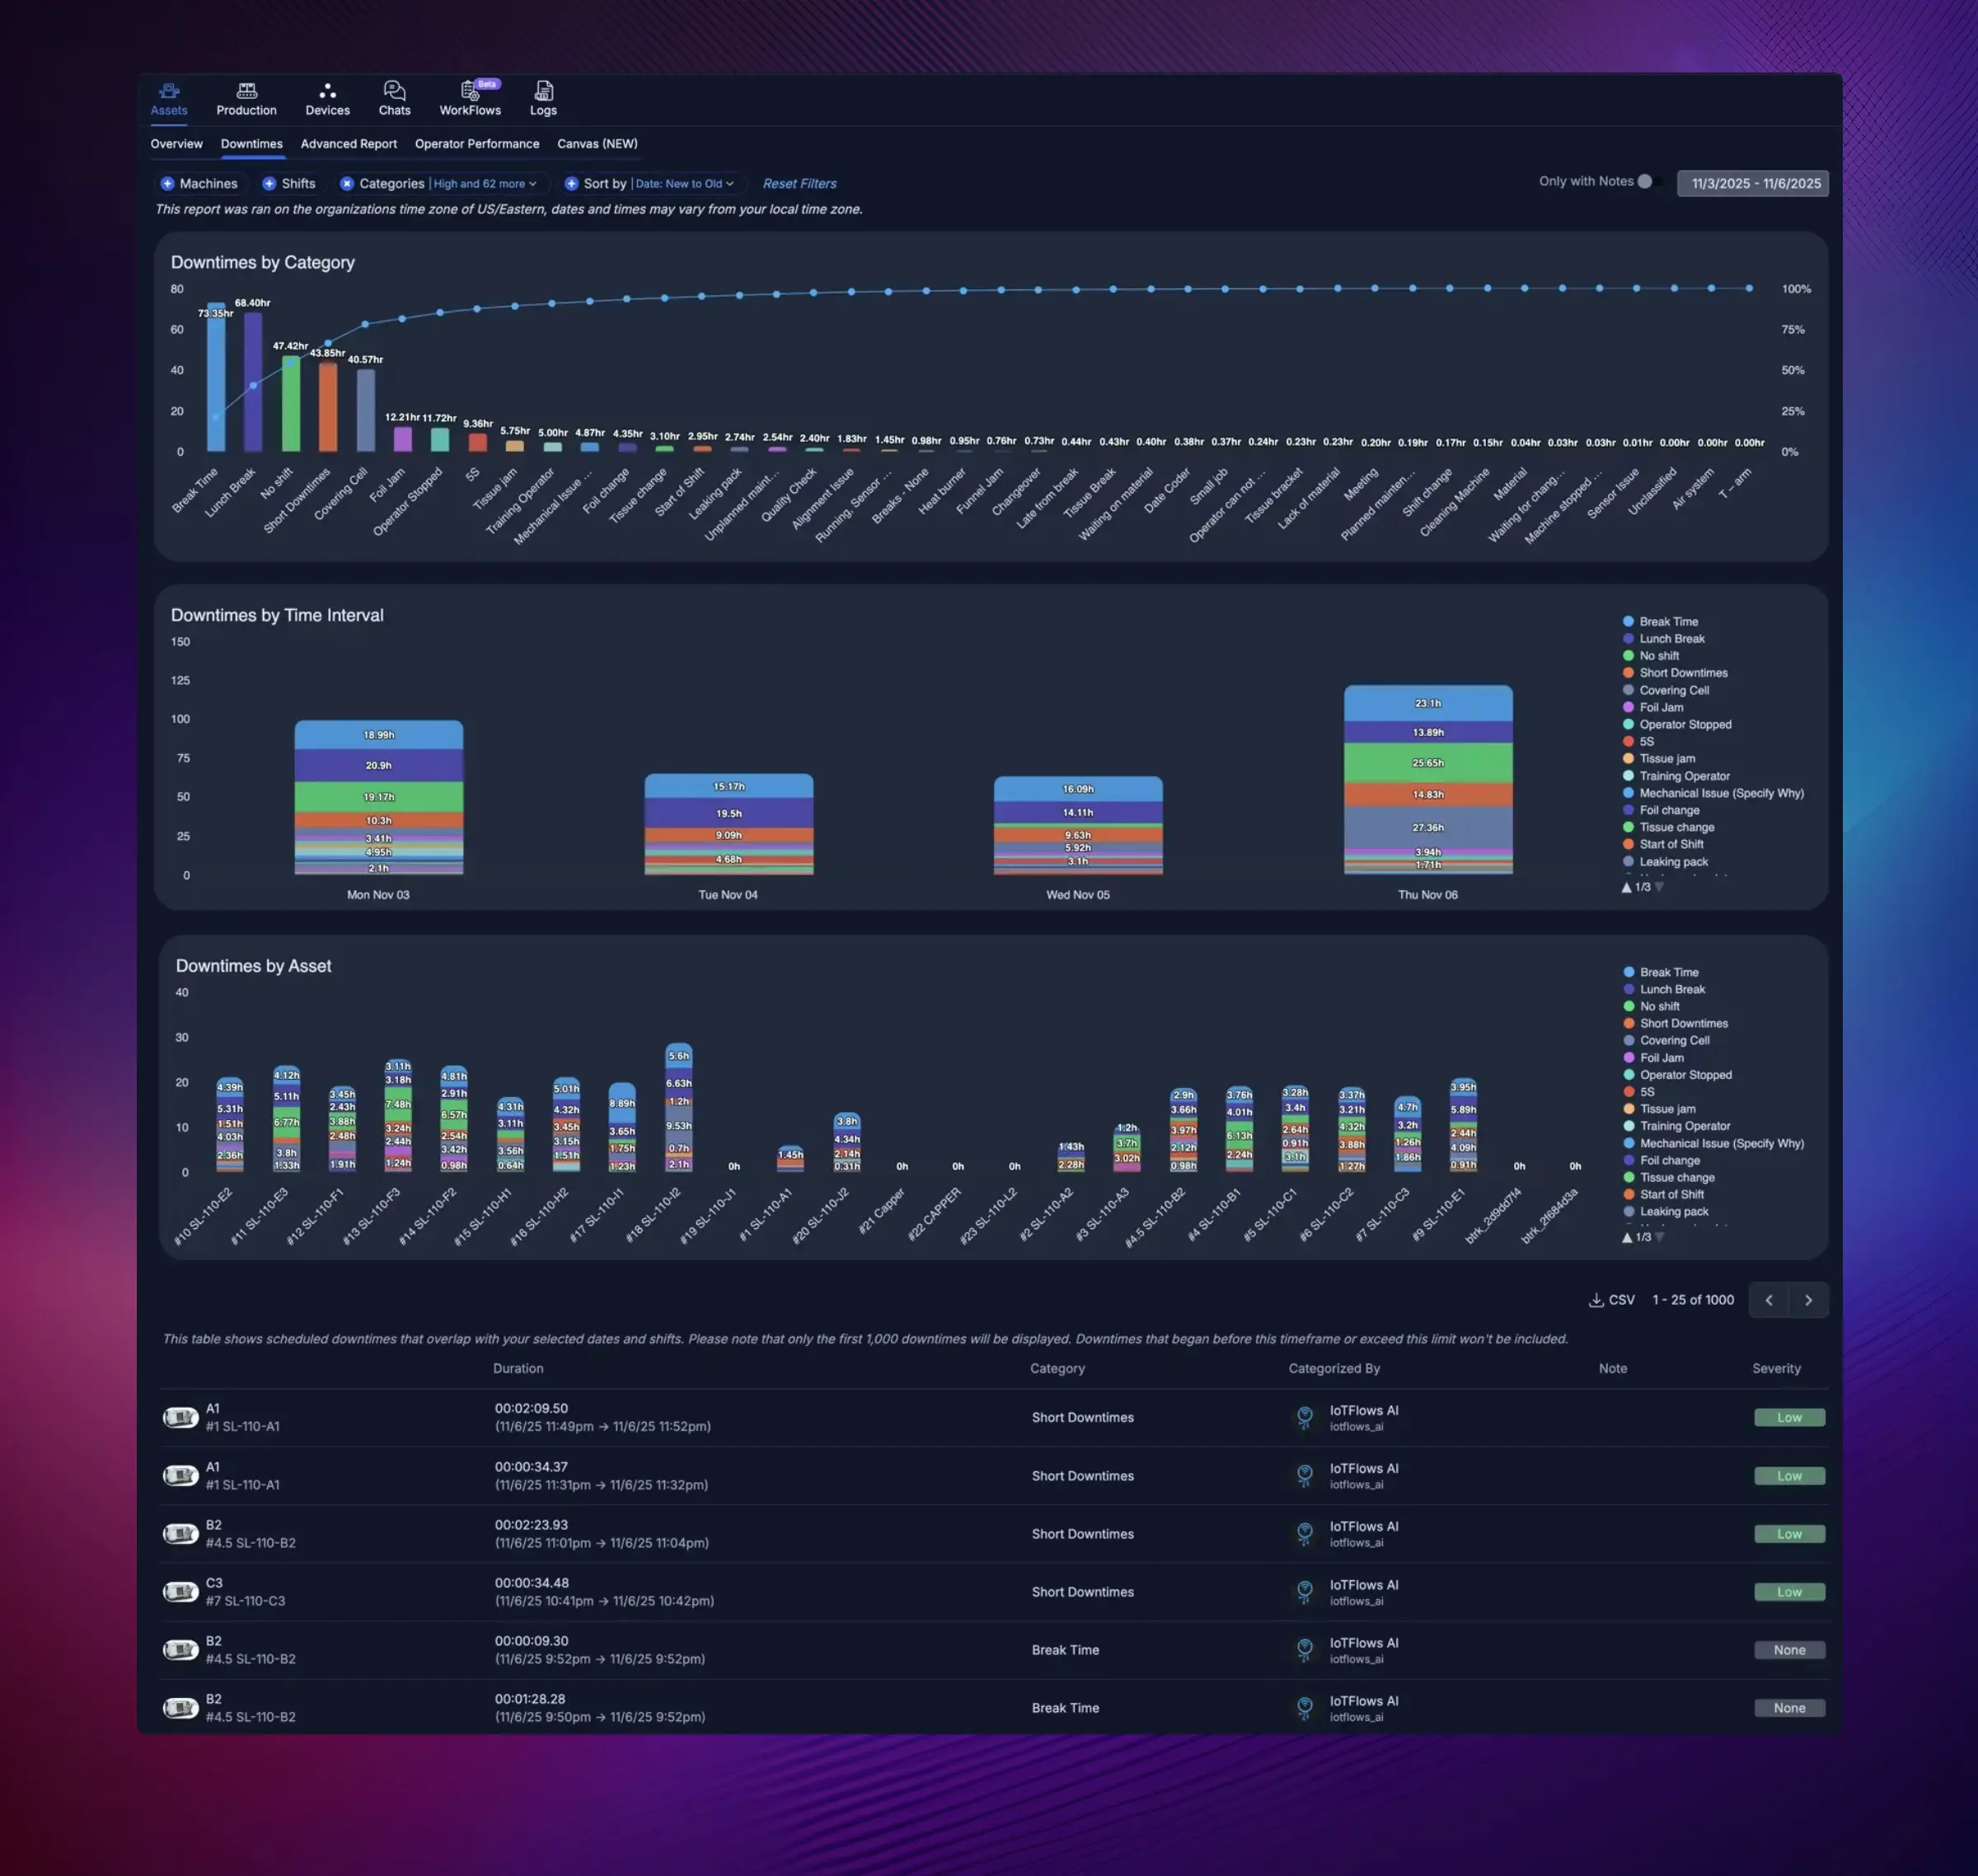
Downtimes by Category (Pareto Chart)
The Pareto chart displays downtime reasons ranked by total duration, following the 80/20 principle. The bar chart shows individual categories while the overlay line shows cumulative percentage.
Key benefits:
- Quickly identify the "vital few" issues causing the majority of downtime losses
- Prioritize improvement efforts on the highest-impact problems
- Visualize the relative contribution of each downtime category
- See percentage breakdowns for each category
Downtimes by Time Interval
This stacked bar chart shows how downtimes are distributed over your selected time interval, with each downtime category represented by a distinct color.
Key insights:
- Track how downtime patterns evolve over time
- Identify trends and seasonal variations
- Monitor the effectiveness of improvement initiatives
- Compare downtime levels across different time periods
- See the breakdown of multiple downtime categories simultaneously
The legend on the right allows you to see all active downtime categories with their color coding.
Downtimes by Asset (Machine Breakdown)
A detailed color-coded bar chart showing downtime distribution for each individual machine or asset in your selection.
What you can see:
- Which machines experience the most downtime
- How different downtime categories are distributed across equipment
- Comparative performance across your production floor
- Duration breakdown for each asset with time labels (e.g., "6.83h", "3.31h")
Interactive Features
- Color-Coded Categories: Each downtime reason has a unique color for easy identification across all charts
- Toggle Reason Codes: Use the legend to show or hide specific categories in the visualizations
- Drill-Down Capability: Click into specific data points to see detailed information
- Hover Details: Get precise values and additional context by hovering over chart elements
Downtime Details Table
At the bottom of the page, a comprehensive table lists individual downtime events with the following information:
- Asset: The machine or equipment that experienced the downtime
- Duration: Total time of the downtime event with start and end timestamps
- Category: The classified downtime reason code
- Categorized By: Shows who or what classified the downtime (operator or IoTFlows AI for auto-classified events)
- Note: Operator descriptions providing context about what happened during the event
- Severity: Visual indicator of the severity level (Low, Medium, High)
Table Features:
- Export data to CSV for further analysis
- Pagination showing first 1,000 downtimes with navigation controls
- Timestamp information showing when events occurred
Auto-Classification
To streamline downtime tracking and ensure data consistency, we strongly recommend setting up automated classification rules.
Learn more: Auto Downtime Classification allows you to create rules that automatically categorize common downtime events such as:
- Short downtimes (brief stoppages under a specified duration)
- Start of shift delays
- End of shift downtimes
- Scheduled breaks (lunch, rest periods, etc.)
Auto-classification reduces manual data entry burden on operators and ensures consistent categorization across your organization.
Best Practices for Downtime Tracking
Deploy Dedicated Operator Workstations
For maximum data accuracy and real-time tracking, we recommend:
-
Mount iPads or Tablets Near Machines: Position dedicated devices close to each workstation for easy operator access during production
-
Assign Devices to Specific Machines: Use the Assign Asset (Operator Mode) feature to pair each iPad/tablet with its corresponding machine. This ensures:
- Operators are automatically directed to the correct machine interface
- Downtime events are logged to the right equipment
- Work session tracking is accurate
-
Empower Your Operators: Train operators to use the devices to:
- Classify downtime reasons as events occur (real-time is most accurate)
- Add detailed notes describing what happened and any actions taken
- Report issues to maintenance or supervisors
- Create requests for repairs, materials, or support
- Communicate quickly to resolve problems and minimize downtime
Benefits of Real-Time Classification
- More accurate data (operators remember details better immediately)
- Faster response times to critical issues
- Better accountability and ownership
- Reduced data entry backlog
- Improved collaboration between operators and management
Getting Help
Have questions about downtime analysis, setting up auto-classification rules, or optimizing your reporting setup? Our sales and support team is here to assist you.
Contact us at support@iotflows.com for assistance with the Downtimes feature.
Monitor real-time machine performance, track utilization and OEE, and gain instant visibility into your production floor.
Generate custom utilization and performance reports with advanced filtering by machine, department, shift, date range, and time interval.