


Datwyler's plant in Ontario, California, runs more than 20 injection molding machines making precision components. With SenseAi on every machine and a reason on every stop, it cut shift-changeover downtime in half and material-changeover downtime by 30% within six months, and the fleet now runs 20% more efficiently.
The Challenge
Datwyler's production managers could see that a machine was down. What they could not see was why. A stop could be a material change, a shift handoff, an equipment fault, a setup or a cleaning cycle, and nothing recorded which.
- No ranking of the losses. There was no systematic way to tell which kind of downtime cost the most.
- Fixes aimed at symptoms. Without causes, improvement work was reactive and scattered.
- No way to tell whether a fix worked. Each shift and each month stood on its own, with no trend to compare against.
- No accountability. Downtime could not be tied to a process, a procedure or a team.
The Solution
Datwyler put SenseAi on its injection molding fleet and made downtime classification part of every shift.
SenseAi on every molding machine
SenseAi detects every stop from the machine's vibration, with no PLC connection and nothing for an operator to start or stop. Each stop lands on the machine's timeline the moment it happens.
The routine stops classified automatically
Three organization-wide automatic rules put a reason on the stops nobody should have to explain: short downtimes, stops at the start of a shift and stops at the end of one. The Downtimes report credits those stops to IoTFlows AI.
A reason on every other stop
Operators and supervisors classify everything else by hand, from a list of downtime categories the plant keeps refining. Every shift handoff, material change and unexpected pause now arrives with a cause.
Weekly and monthly reports
Rather than watching live dashboards, Datwyler reviews the Downtimes report week over week and month over month, with the reports emailed on a schedule.
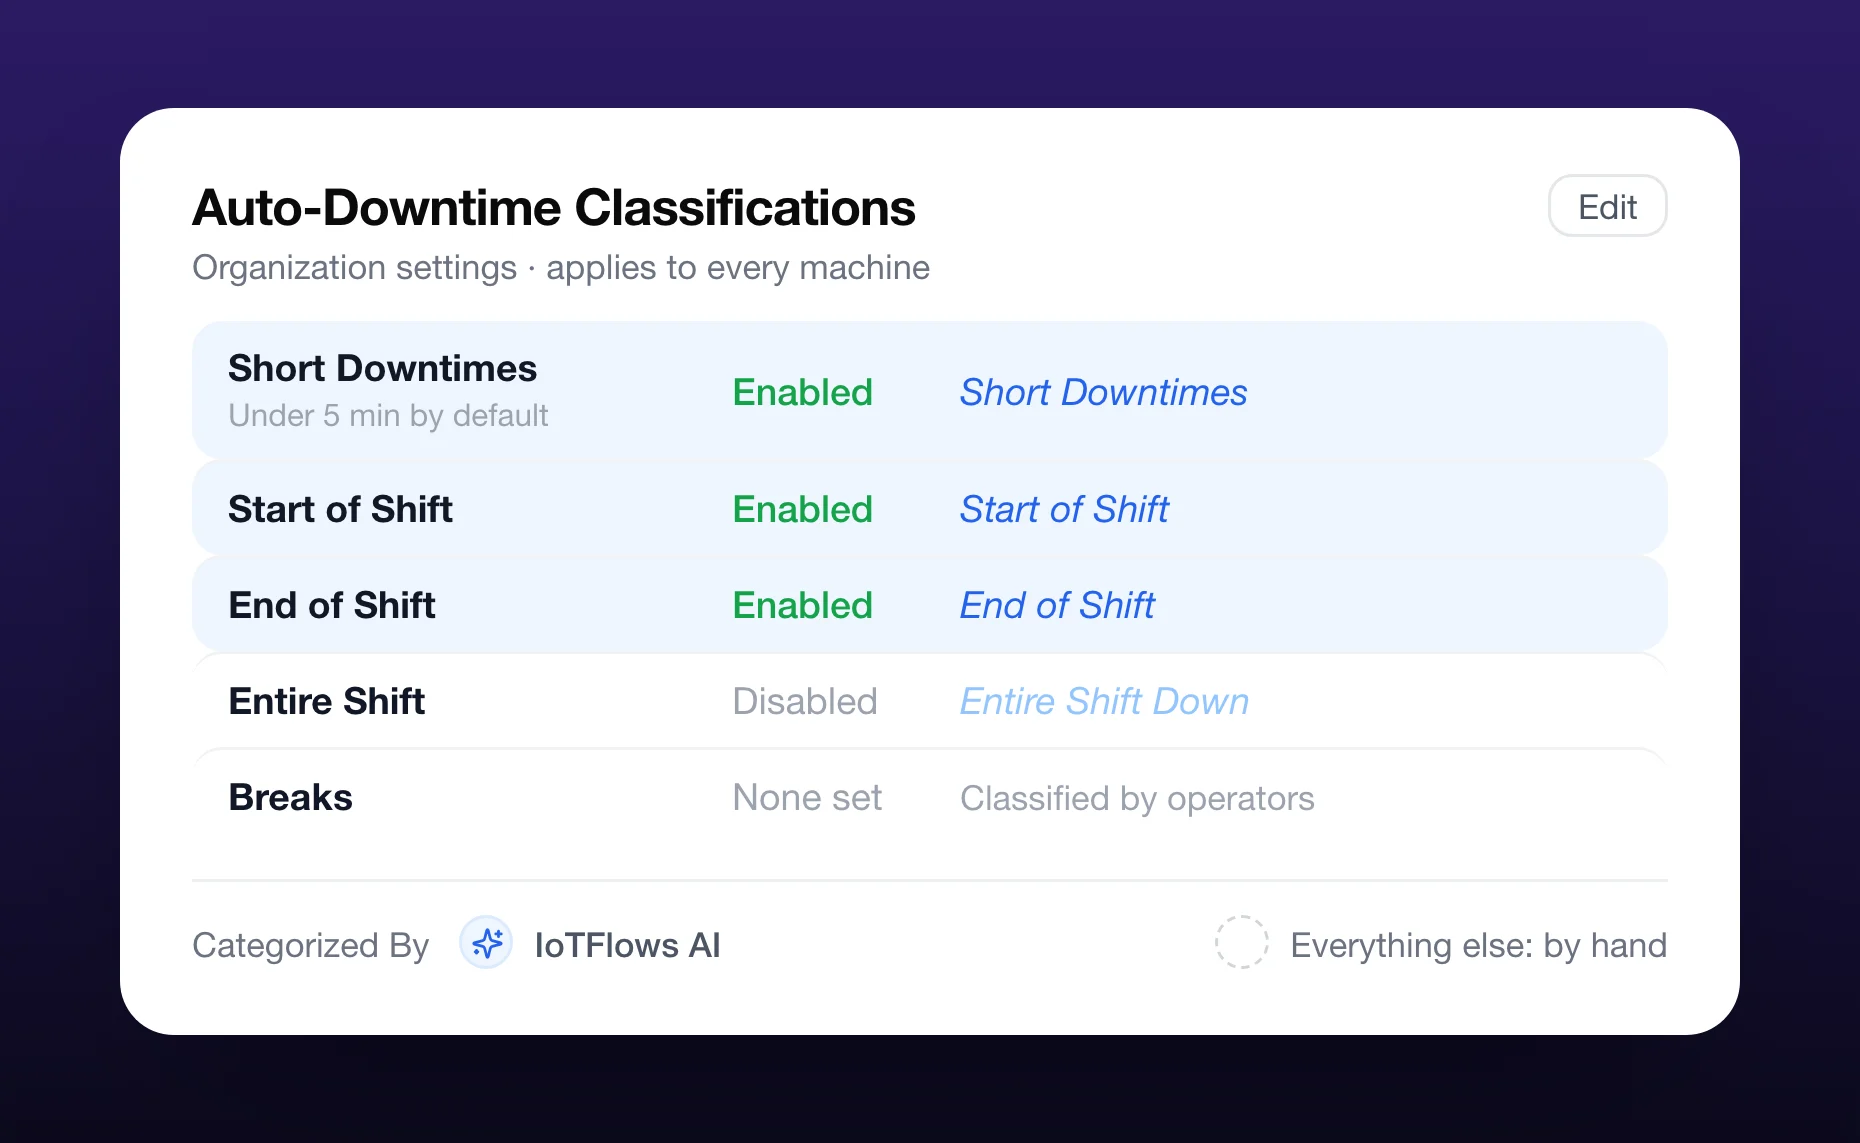 The rules Datwyler runs: short downtimes and the start and end of each shift are classified automatically; operators and supervisors classify the rest.
What the history showed
The weekly and monthly views revealed patterns that were invisible day to day.
Week over week, Datwyler could see which days consistently had longer shift changeovers, whether material-change procedures were improving, and how new operators performed in their first weeks. Tuesday shift transitions turned out to add 8 to 10 minutes of downtime, every week: too small to notice on the day, costly over months.
Month over month, the team tracked the cumulative effect of each improvement, found the persistent problems worth an engineering fix, compared production teams and set data-backed targets for the next cycle. Supervisors who see their shift's numbers improve in the weekly report become advocates for the process.
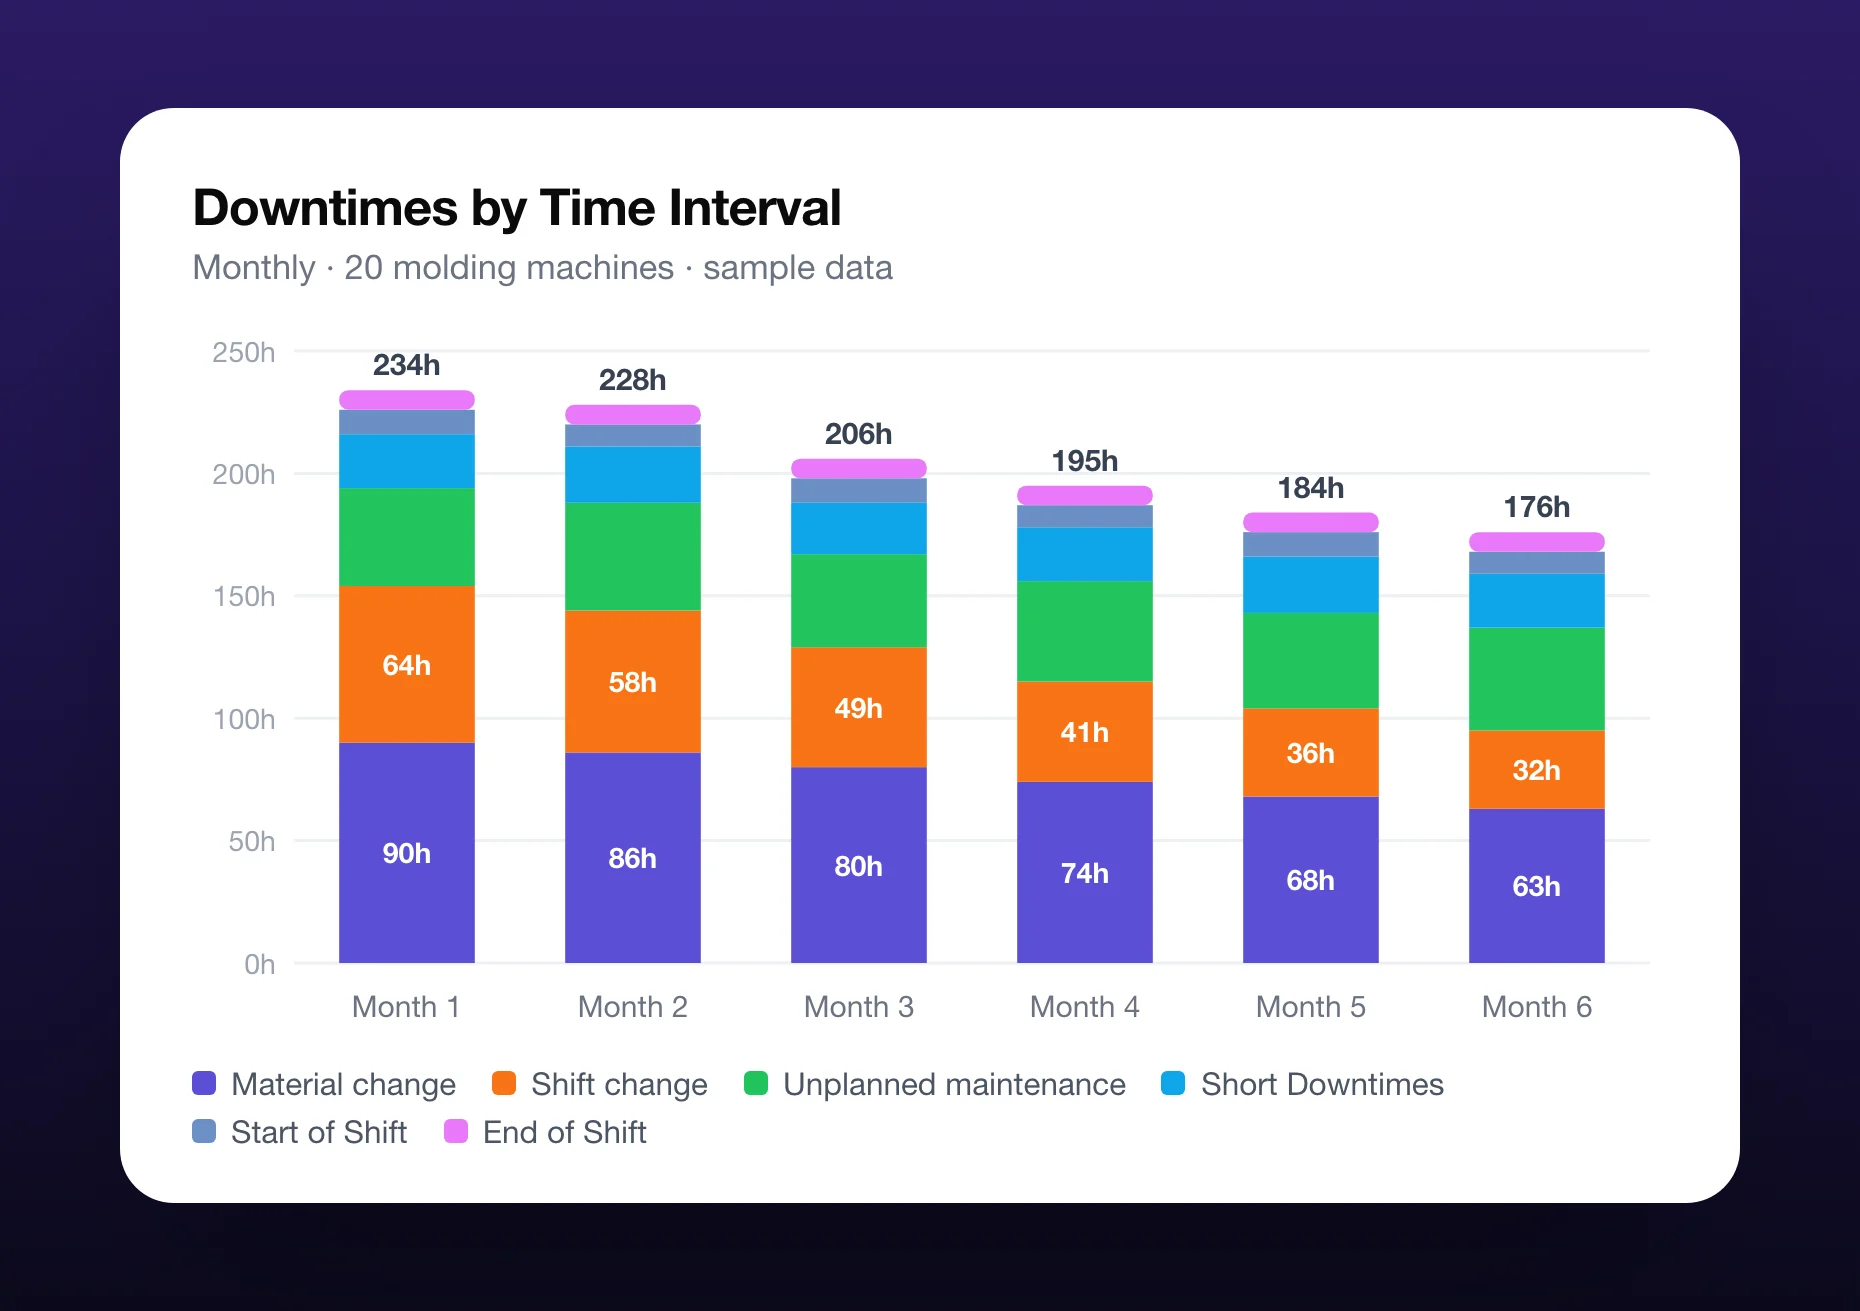 A simplified view of six months like Datwyler's, in sample data: shift-change downtime halves and material-change downtime falls by 30%, while the other reasons hold steady.
The Results
Downtime Transformation
- 50% less shift-changeover downtime, from streamlining the handoff procedures the reports exposed
- 30% less material-changeover downtime, from targeting the material types that needed the longest setups
- 20% higher efficiency across a fleet of more than 20 injection molding machines
- Within six months of putting SenseAi on the fleet
- A reason on every stop, automatic for the routine ones and by hand for the rest
- Evidence over opinion: improvement work is chosen from cumulative charts, and each fix is checked against the weeks that follow
"IoTFlows didn't just give us data—it gave us a method. By tracking downtime categorization week to week and month to month, we could see exactly where our biggest problems were and track whether our fixes actually worked. The 50% reduction in shift changeover time came directly from acting on patterns we saw in the historical reports. That's not luck; that's discipline meeting data."
Brien Stevenson, Site Director, Datwyler
The Features Behind It
- SenseAi on every molding machine, detecting each stop from vibration. See SenseAi.
- Automatic classification of short downtimes and shift starts and ends. See Classify downtime automatically.
- Downtime categories under severity headings, refined as the plant learns. See Manage downtime categories.
- Classification by operators and supervisors for every other stop. See Classify a downtime event.
- The Downtimes report, with the Pareto and the by-interval trend. See Analyze downtime with Pareto and trend charts.
- Scheduled reports for the weekly and monthly reviews. See Email a report and schedule it to repeat.
See how it works on downtime tracking.