

Detect operations automatically
Let a machine work out which operation it is running, instead of telling it at every changeover.
Auto-detection is the setting that lists the operations a machine should watch for. IoTFlows matches the sensor's signal against that list and files each cycle it recognizes under one of the operations on it. A machine with nothing assigned still reports uptime and downtime, and its parts column stays empty.
Every entry point into auto-detection is on the machine. This page covers all of them, plus the one shortcut that sets a whole line in a single action.
Before you start
- A part with at least one operation, and a detection algorithm on that operation. See Create parts and operations.
- The machine has to run the operation while it is assigned. Nothing is detected from an idle machine.
Looking for this on the Parts List? It is not there. The Parts List defines what an operation is: its algorithm, its ideal cycle time, its quantity per cycle. Assigning an operation to the machine that runs it happens on the machine, through the modal below.
When auto-detection helps
Assign operations when:
- The machine runs parts you can name in advance. Assign every discrete operation it runs, in one pass, and leave them assigned.
- Counts have to survive a changeover with nobody at a keyboard.
- You entered an ideal cycle time you are not confident in, and want a measured figure to check it against.
You do not need auto-detection to see whether a machine is running. Uptime, downtime and OEE come from the sensor alone, see How each metric is calculated. Auto-detection is what turns that running signal into a part count, a production rate, and a shift goal.
Start from a machine's detail page
This is the path the rest of the production docs use, and the one to take when you are setting up a single machine.
- Open Assets and select the machine, for example
HAAS VF-2. The address is/assets/selected-asset/:id. - Select Auto-Detect in the control bar. Select Auto-Detect Operations opens.
On a phone the same control is an icon in the page header rather than a labeled button. Both open the same modal.
 The Auto-Detect button in the control bar of a machine's detail page, which opens Select Auto-Detect Operations.

Start from the Assets page
The Assets page opens the same modal without leaving the fleet view, which is the faster path when you are setting several machines in a row.
- Open Assets at
/assetsand switch to list view. - Find the machine's row. The block in the middle names the operation it is detecting now, its part, and its count.
- Select that block. Its tooltip reads Switch operation.
A machine with nothing assigned carries a Set operation button in the same place. Cascading group cards carry the block as well, so a line drawn as a cascade can be switched machine by machine from the card. Plain cards outside a cascade have no entry point, so use list view or the machine's detail page.
 The second entry point: the operation block on an Assets list row, whose tooltip reads Switch operation.

Choose the part and operations
The modal lists every operation in the organization that the machine's device can detect, each row naming the operation and the part it belongs to. The device decides the tabs:
- A SenseAi or SenseAi Embedded shows Discrete and Continuous.
- A BeamTracker shows Count and nothing else.
To find an operation in a long list, type into the search box at the top. It searches part name, operation name and description, and the server does the filtering, so an operation you have not searched for may not be in the list.
On the Discrete tab, check every operation the machine runs, then select Auto-Detect. The tab takes checkboxes, so one pass covers every part on the machine. IoTFlows confirms with Discrete Auto-classification Set and closes the modal.
On the Continuous and Count tabs, select one operation. Both are radio buttons. They save the moment you select, confirm with Continuous Auto-Classification Set or Count Auto-Classification Set, and close. Neither has a submit button, only Close.
To stop a continuous machine detecting without choosing another operation, select No Continuous Detection at the top of the list. The Count tab carries no equivalent row.
The two tabs are exclusive, and each says so above its list. Selecting discrete operations clears the machine's continuous operation, and selecting a continuous operation clears every discrete one.
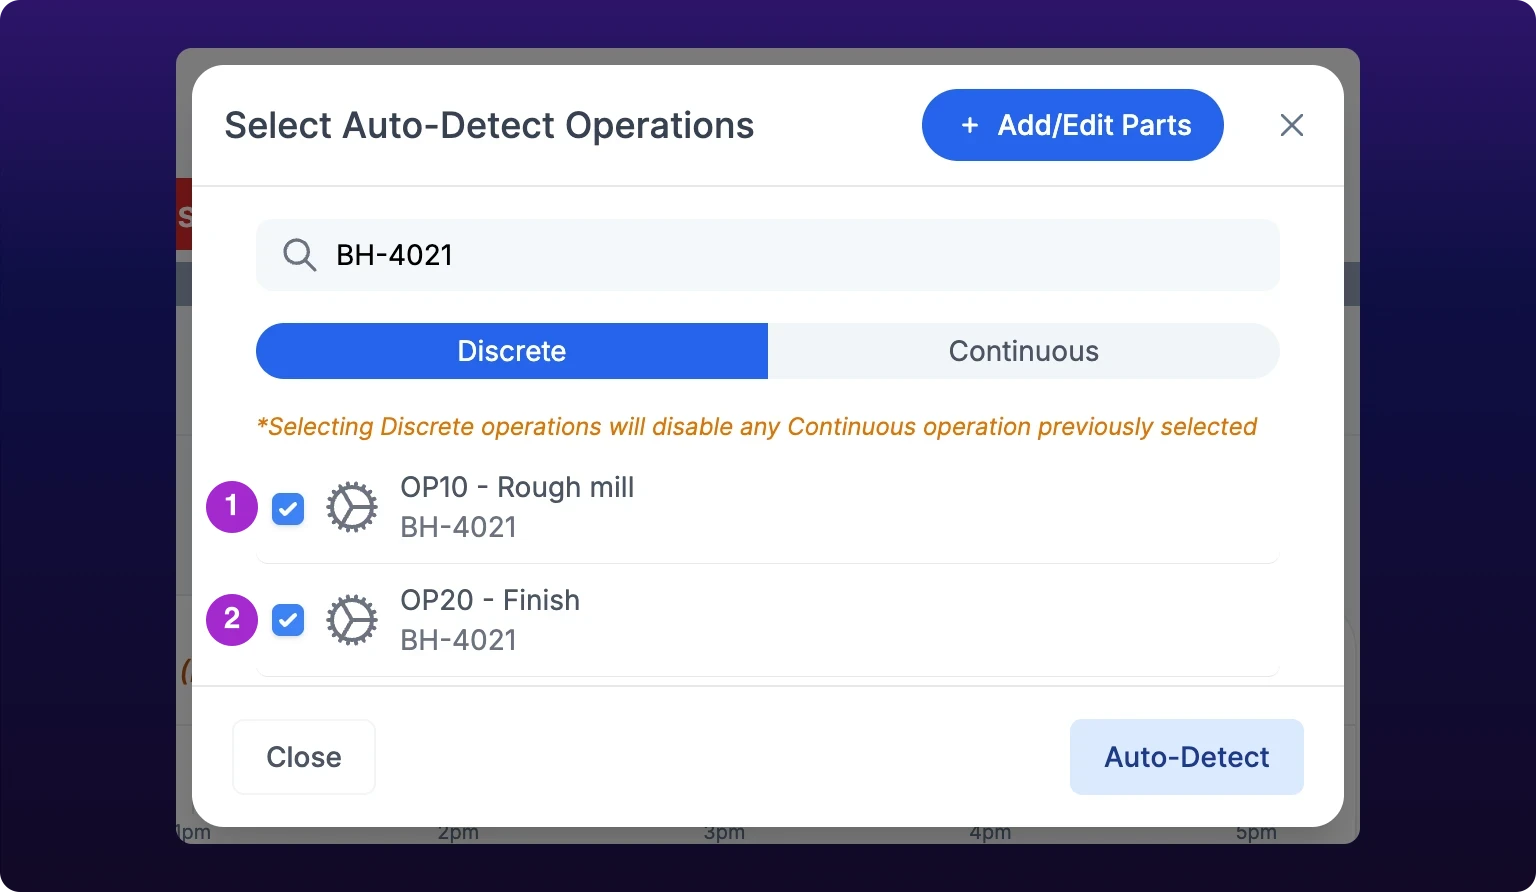 Choosing which part and operations to detect. The Discrete tab takes checkboxes, so one pass assigns every operation the machine runs.
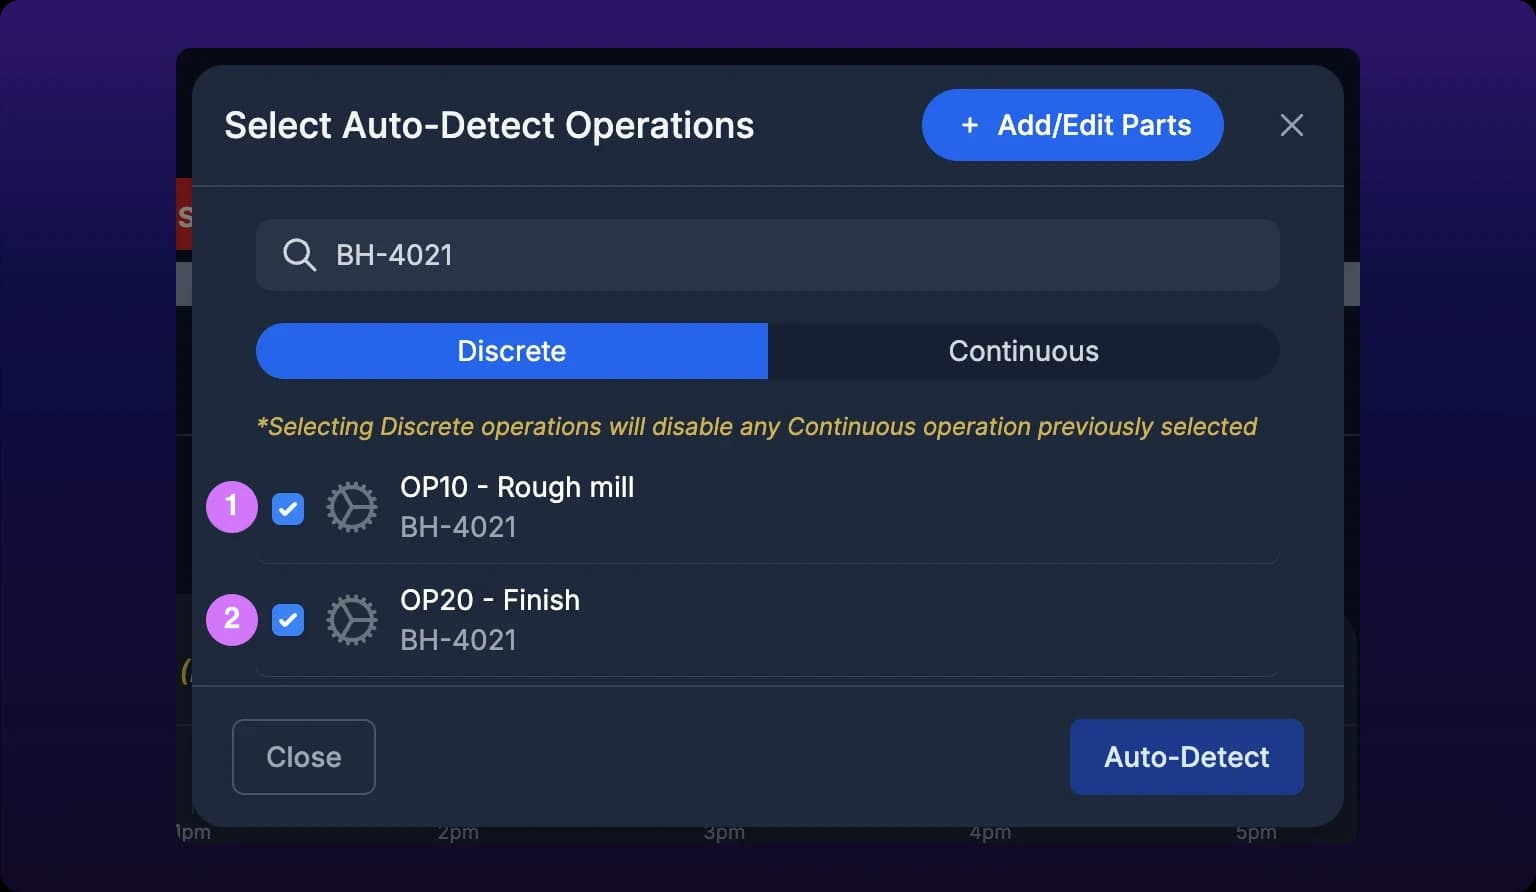
Choose the detection algorithm
The algorithm is a field on the operation, not on the machine, and it decides which tab the operation appears under: the two discrete algorithms put it on Discrete, Continuous Analysis on Continuous, and Counter on Count. Which one to pick is on Choose a production tracking algorithm.
An operation with no algorithm never appears in this modal. The modal states it outright: "Operations without a detection algorithm will not appear in the auto-detect selection list." So does the device mismatch. A SenseAi will not show a Counter operation, and a BeamTracker will not show a discrete or continuous one.
If the operation you want is missing, fix it without leaving the modal:
- Select Add/Edit Parts in the header. The modal becomes Add/Edit Parts & Operations.
- Search for the part, or type a new name and select Create "name".
- Select the part, type a name under New Operation, then select Add.
- Expand More details (optional) and set Detection Algorithm. Set Qty per Cycle and Cycle Time (sec) here too if you know them. Unlike the Parts List, cycle time here is one plain number in seconds.
- Select Done — Back to Operations. The list reloads and the new operation is in it.
Use the pencil beside an existing operation to change the same three fields on it.
Review the detected cycle time
Let the machine run the operation, then open its row on the Assets page. Beside the operation block it reports two figures:
- Cycle time, the detected cycle time: the running time between counted parts, measured from the detection events themselves.
- Production rate, the same number inverted, in the operation's unit per minute.
Neither is the number you typed. The ideal cycle time on the operation is a target, and this is what the machine actually did. Comparing the two is the quickest check that the algorithm and the assignment are both right.
For example, a machining center set to a 90 second ideal that reports a detected 92 seconds is working. One that reports 8 seconds is counting something that is not a part.
Read the detected figure only over a window that ran one part mix. If the machine changed over inside the window, the detector averages two parts into a single number that describes neither, and the fix is a stopwatch on the part you care about, not a different setting.
 The measured cycle time and production rate on an Assets list row, after the machine has run the operation. An implausible figure means the machine ran something else during the window.

Accept or adjust
Nothing has to be accepted. The assignment is already live and the detected cycle time is a reading, not a proposal. What you do next depends on what the reading says.
| What the detected cycle time says | What it means | What to change |
|---|---|---|
| Close to the ideal cycle time you entered | The algorithm and the assignment are both right | Nothing |
| Roughly half or double the ideal | The signal is being merged or split wrongly | Switch the operation's algorithm, see Switch to a different algorithm |
| Plausible, but the ideal is a long way off | The ideal cycle time was a guess | Re-time the cycle and correct it, see Set cycle times and downtime filters |
| Nothing at all, after the machine has run | No operation is assigned, or the wrong one is | Reopen the modal and check the selection |
| Implausible on every reading | The machine is running something other than the assigned operation | Assign the operations it actually runs, or cut the window to one part |
Counts that are still wrong after that are on Troubleshoot inaccurate part counts.
Set a whole cascade in one action
Machines grouped into a cascade get a group-level shortcut. Set Part in the group header picks one part, pre-fills each machine with the part's operation matching its step number, and applies the lot in one request per machine. It writes exactly the same setting as Switch operation on a single card.
The procedure, its Don't change option, and what a half-successful run looks like are on Group machines into cascades. The shortcut is the only part of auto-detection that is role gated: Set Part is disabled unless you sign in as an Organization Owner or Organization Administrator, see Roles reference.
Auto-detect fields
| Field | Required | Effect |
|---|---|---|
| Search | No | Filters the list by part name, operation name or description. The server filters, so an operation you have not searched for may not be listed |
| Discrete checkboxes | On a SenseAi running discrete operations | Check every operation the machine runs. Nothing is saved until you select Auto-Detect |
| Continuous radio | On a SenseAi running a continuous operation | Saves the moment you select it, then closes the modal |
| No Continuous Detection | No | The first row of the Continuous tab. Clears the machine's continuous operation and leaves it detecting nothing |
| Count radio | On a BeamTracker | The only tab a BeamTracker shows. Saves on selection, like Continuous |
| Auto-Detect | On the Discrete tab | Submits the whole checked set as the machine's operations. The other two tabs have no submit button |
| Add/Edit Parts | No | Opens Add/Edit Parts & Operations inside the same modal, for creating or correcting the operation you are missing |
See also
From the blog
The detection algorithm on an operation is the rule that turns a sensor's signal into part counts. BeamTracker takes Counter and nothing else. A SenseAi machine takes Continuous Analysis when the trace never returns to the stopped level, Discrete Analysis when each part is one burst with idle time around it, and Discrete w/o Merge when every impact is a part. Compare all four, validate against a hand count over ten parts, and switch without losing the operations already assigned to a machine.
Three numbers on an operation decide whether counts and goals match the floor: the ideal cycle time in the Ideal Operation Cycle Time column of the Parts List at /production?select=parts_list, the quantity per cycle in QTY/OP, and the continuous downtime filter percentage, which only Continuous Analysis operations carry and which accepts 0 to 200%. Production rate is the same number inverted, 60 divided by the cycle in seconds. The Calculated Goal on Shift Production, the parts gauge and the hourly bars are all derived from the ideal cycle time, and none of them can be set anywhere else.