

Track production against shift goals
See whether this shift will hit its numbers, operation by operation and machine by machine.
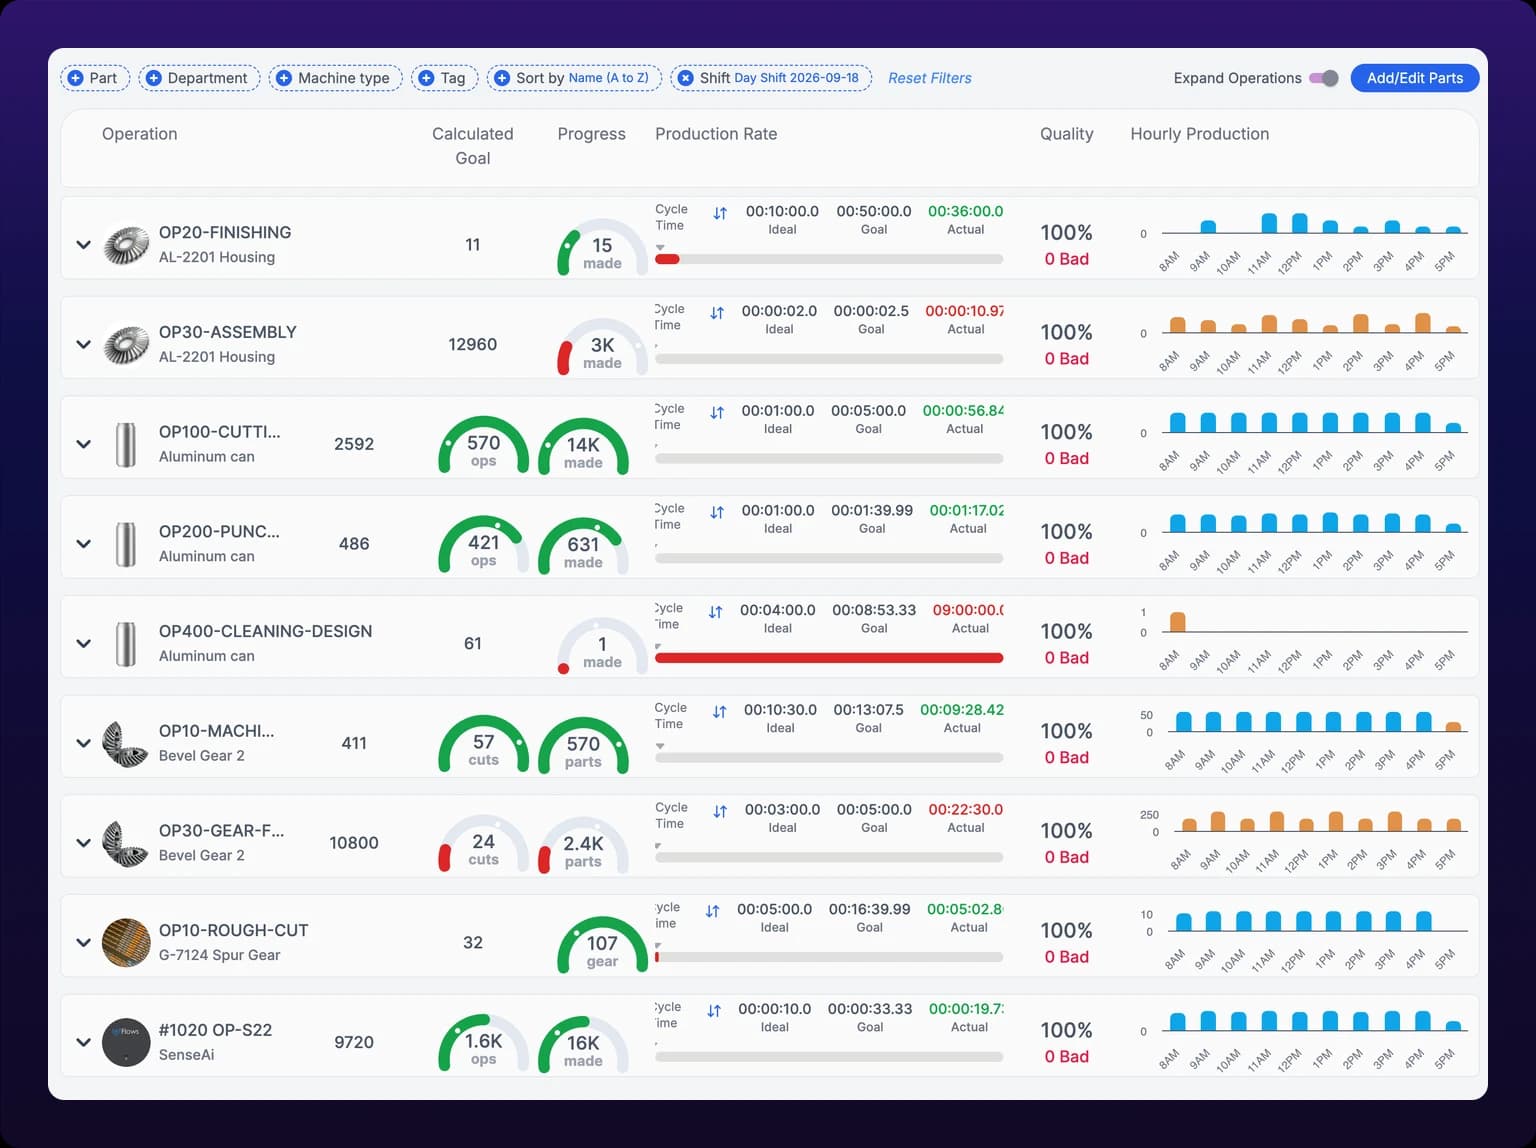
Shift Production is the board you leave open while a shift runs. It lists every operation that has produced since the shift started, with the parts counted so far against the goal for the shift, the pace each machine is holding, and an hourly bar chart showing where the output landed.
Nothing on this page is editable. It reads the numbers other pages set, which is what makes it safe to put on a screen the whole cell can see.
Before you start
- Create the part and at least one operation, and assign the operation to a machine. See Create parts and operations.
- Set an ideal cycle time on the operation. Without one, every goal on this page reads
0. See Set cycle times and downtime filters. - Have your shifts defined for the organization. See Shifts and time zone.
There is no role gate. Anyone who can see a machine can read its production board.
Read the board
Open Production, then the Shift Production tab, at /production?select=part. On a phone the tab is labeled Shift.
Every row is one operation, with the part it produces named underneath, for example OP100-CUTTING-BLANK over Aluminum can. Six columns follow it.
An OEE goal is the single target percentage every gauge in IoTFlows is colored against. Each machine inherits the organization's until you give it one of its own. See Set OEE and utilization goals.
| Column | What it shows |
|---|---|
| Operation | The operation name, the part beneath it, and the part picture where one is set |
| Calculated Goal | The number of good parts this operation should finish during the shift |
| Progress | A half gauge. The center number is good parts made so far, labeled with the operation's own unit, and the arc fills to the percentage of the goal reached. A tick on the arc marks the OEE goal |
| Production Rate | Three figures, Ideal, Goal and Actual, over a bar drawing the measured cycle time with an arrow at the ideal. The swap arrow flips all three between a cycle time and a rate per minute, for example 00:00:00.50 and 120.0 ops/min |
| Quality | Good parts as a percentage of everything counted, with the bad count beneath it in red |
| Hourly Production | One bar per clock hour of the shift |
An operation that runs on more than one machine carries a chevron at the left of its row. Select it to expand the operation into one line per machine, carrying the same columns. That is the only place the board separates two machines running the same operation, so it is where you go when the operation total is behind and you need to know which machine is dragging it.
Operations with a quantity per cycle other than 1, meaning one cycle that yields more than one part, draw a second gauge to the left of Progress counting cycles rather than parts.
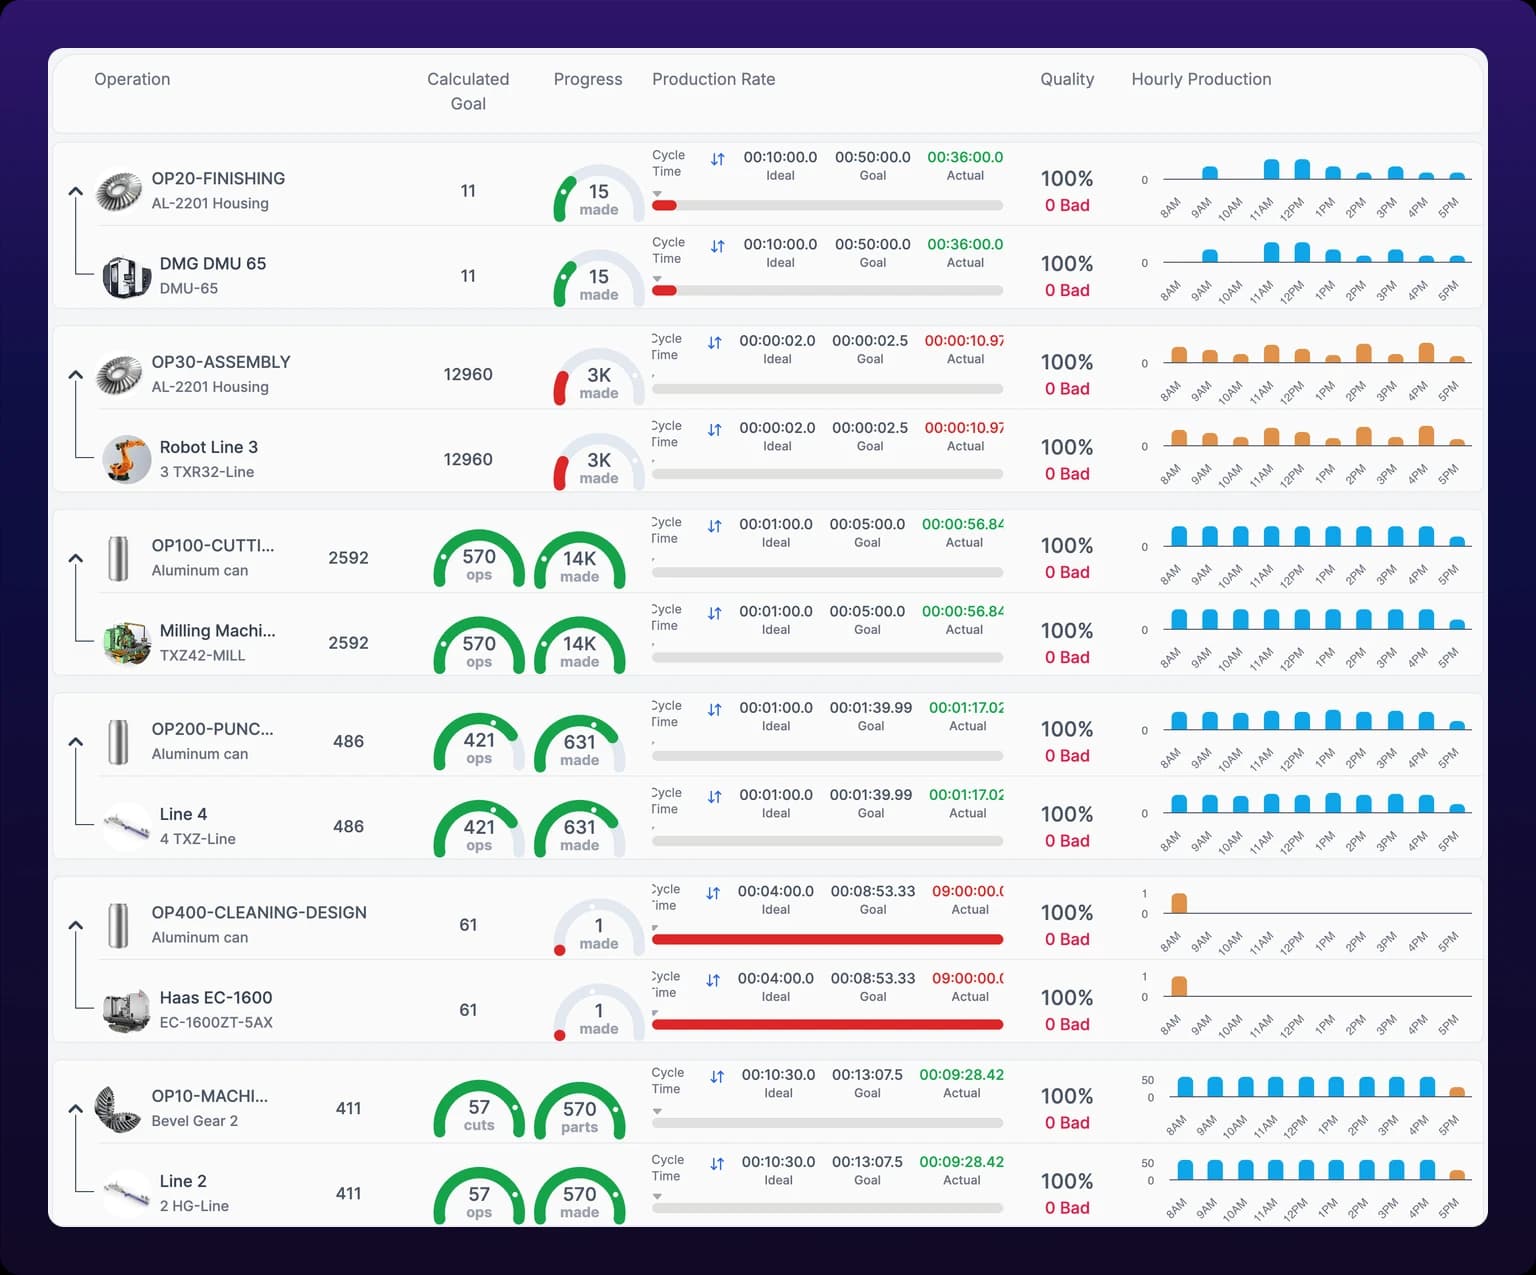 Live shift production. Counts per operation and per machine against the shift goal.
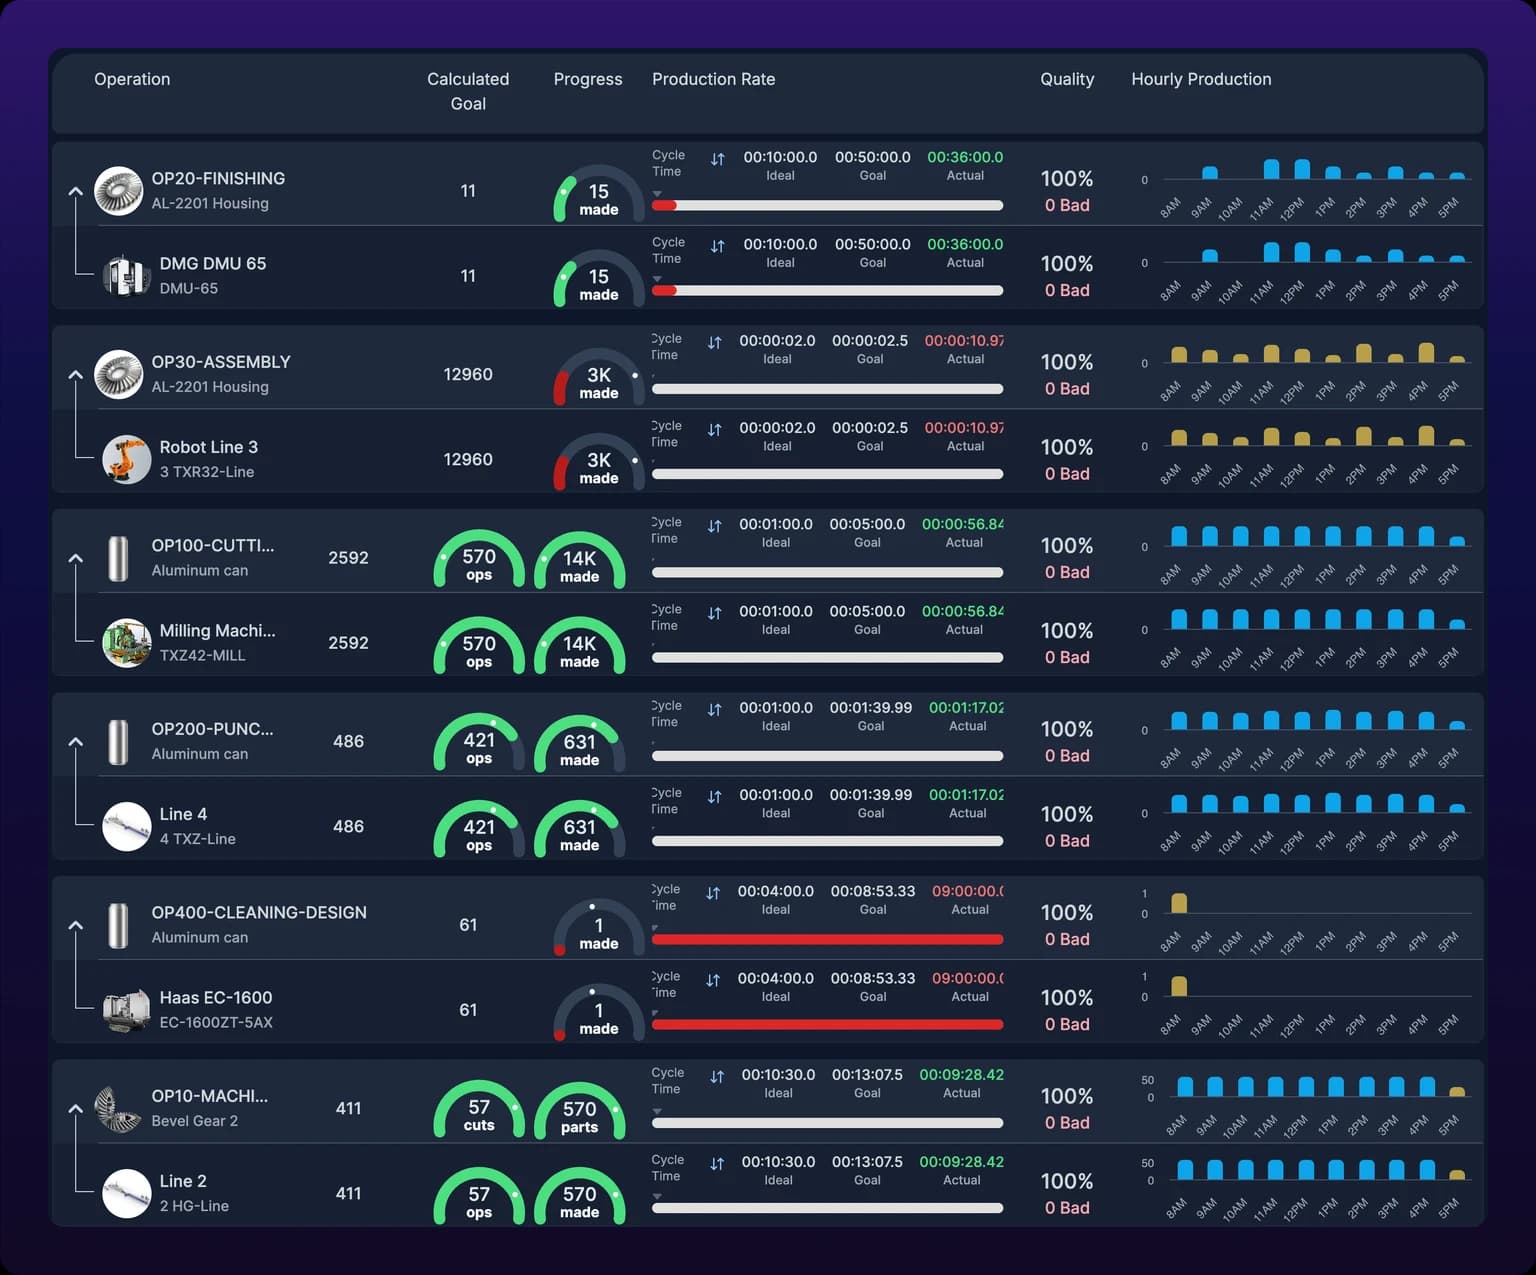
The gauges are green or red, never orange. The Progress gauge draws green while the percentage of the goal reached is at or above the machine's OEE goal, and red below it. The cycle-time bar underneath the rates is green while the measured cycle is faster than the ideal, and red the moment it reaches or passes the arrow. See Set OEE and utilization goals.
You do not need this page to know whether a machine is running. Machine state, uptime and downtime live on the Assets page and do not need a part, an operation or a cycle time. See Monitor your fleet on the Assets page.
Read the hourly bars
Every operation row, and every machine row inside it, draws one bar per clock hour since the shift began. Good parts go up from the zero line and scrap hangs below it in red. Hover a bar for its Good and Bad counts.
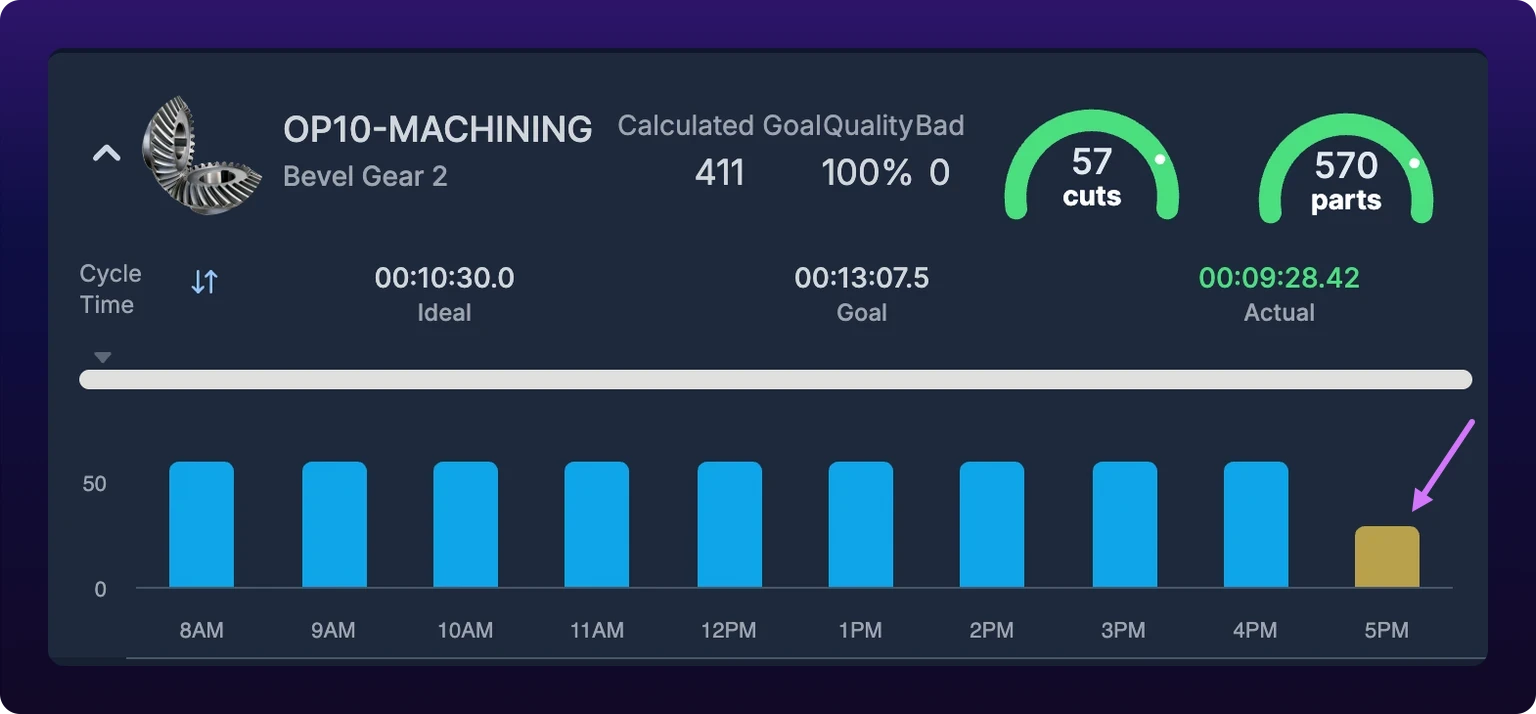
The bar color is the hour's own verdict. Blue means the hour met or beat its hourly goal; amber means it fell short. The hourly goal comes from the ideal cycle time and the machine's goal, see Production metrics.
This is the part of the row that does not average. An operation can sit at 96% of its shift goal with a green gauge and still carry one amber hour that lost 60 parts, and that hour is the one worth asking about while the shift is still running.
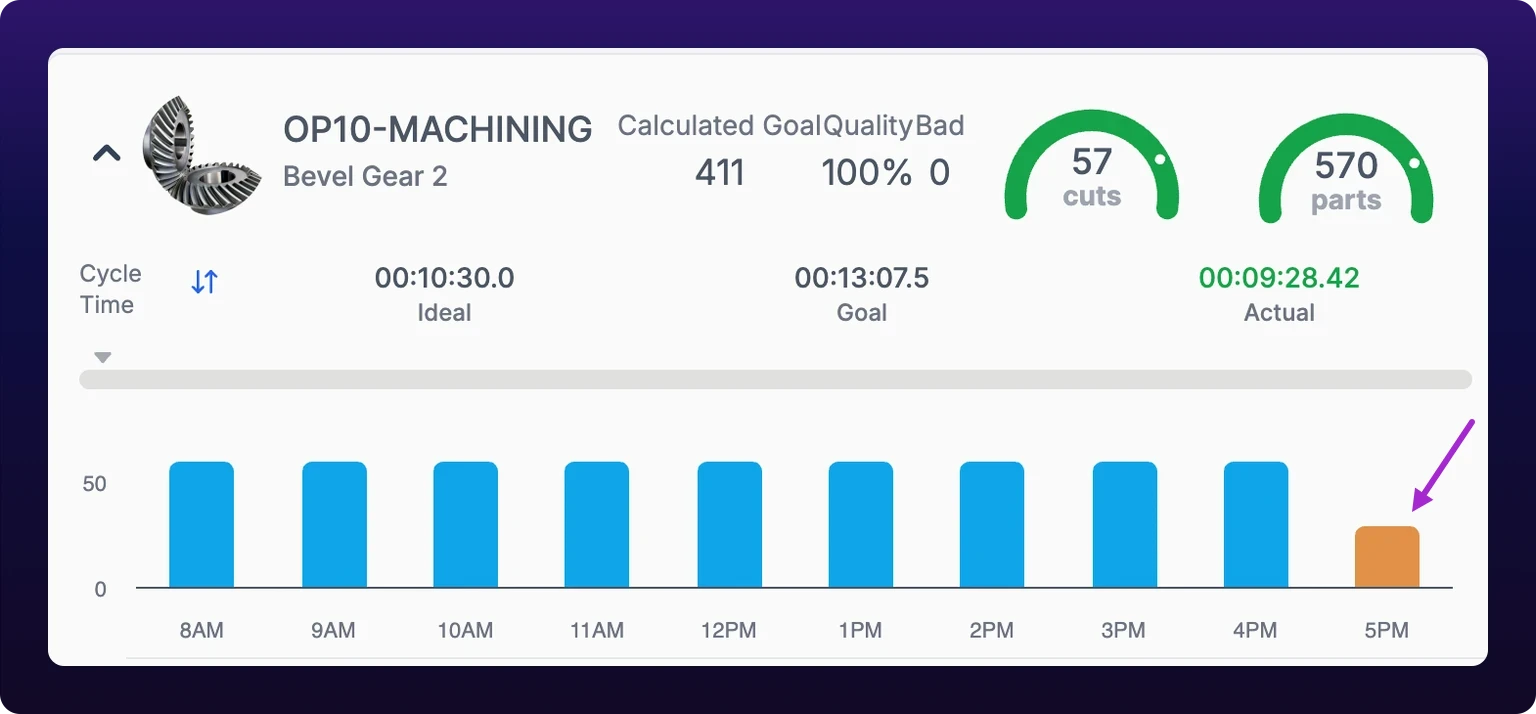 Hourly production against the calculated goal.
Filter the board
Six filters sit across the top of the page, with Reset filters at the end of them.
| Filter | Values | Effect |
|---|---|---|
| Parts | Any part in the organization, multi-select | Shows only operations that produce the selected parts |
| Departments | Any department, multi-select | Shows only operations running on machines in those departments |
| Machine type | Any machine type, multi-select | Shows only operations running on that class of equipment |
| Tags | Any asset tag, multi-select | Shows only operations on tagged machines |
| Sort by | Name (A to Z), Name (Z to A), Department, Machine type | Reorders the rows. It does not sort by progress or by rate |
| Shift | A named shift, All Day, or Custom Time with your own start and end in 30-minute increments, on yesterday or any past date | Sets the window every count, goal and bar on the page is calculated over |
Shift defaults to the shift you are in right now, or to All Day when the current time falls outside every named shift. The filter is the same control the Assets page carries, see Choose the window.
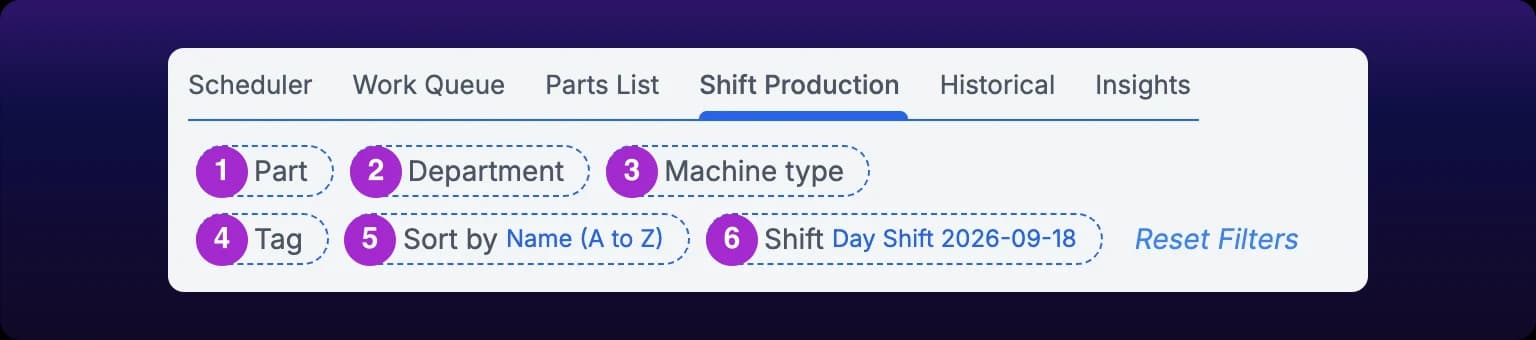 The six filters on the shift view.
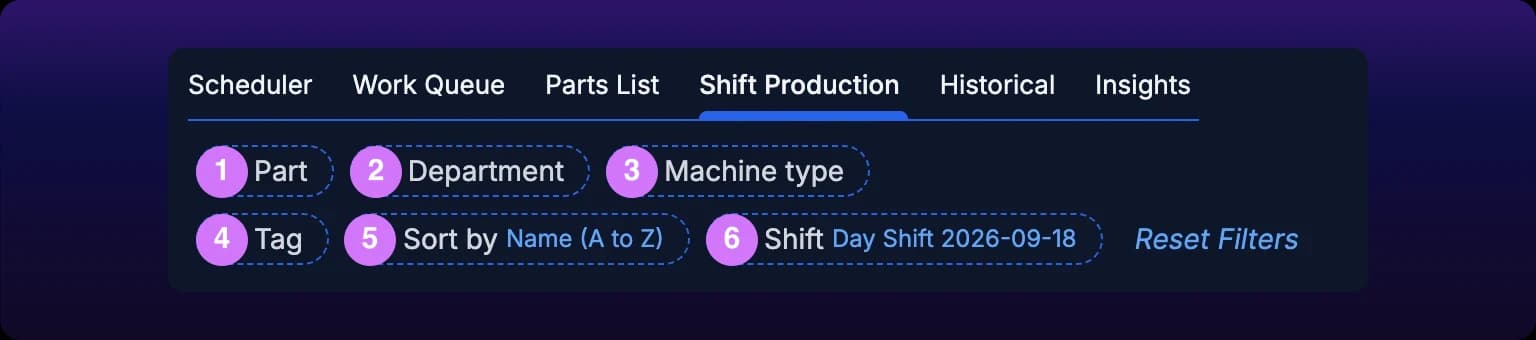
Every filter writes itself into the address bar, so the URL is the view. Copy it, bookmark it, or send it to a screen and it reopens filtered exactly as you left it. Reset filters clears all six and returns the board to the current shift.
Put the board on a TV
The board is built to be sent to a wall display, and the control that makes it readable from across a cell is the Expand Operations switch at the top right.
- Filter the board down to the cell the screen belongs to, usually with Departments or Tags.
- Set the switch. Its label names what flipping it will do: Collapse Operations while machine rows are showing, Expand Operations while they are hidden. Collapsed, each operation is one line and its per-machine rows are hidden.
- Add
&hide_tabs=trueto the URL to drop the Scheduler, Work Queue, Parts List, Historical and Insights tab bar from the top of the page. This is read when the page loads, so it has to be in the URL before you send it. - Copy the address bar and send it to the screen. See Send a view to a paired screen.
 TV collapse mode, for a wallboard at the cell.
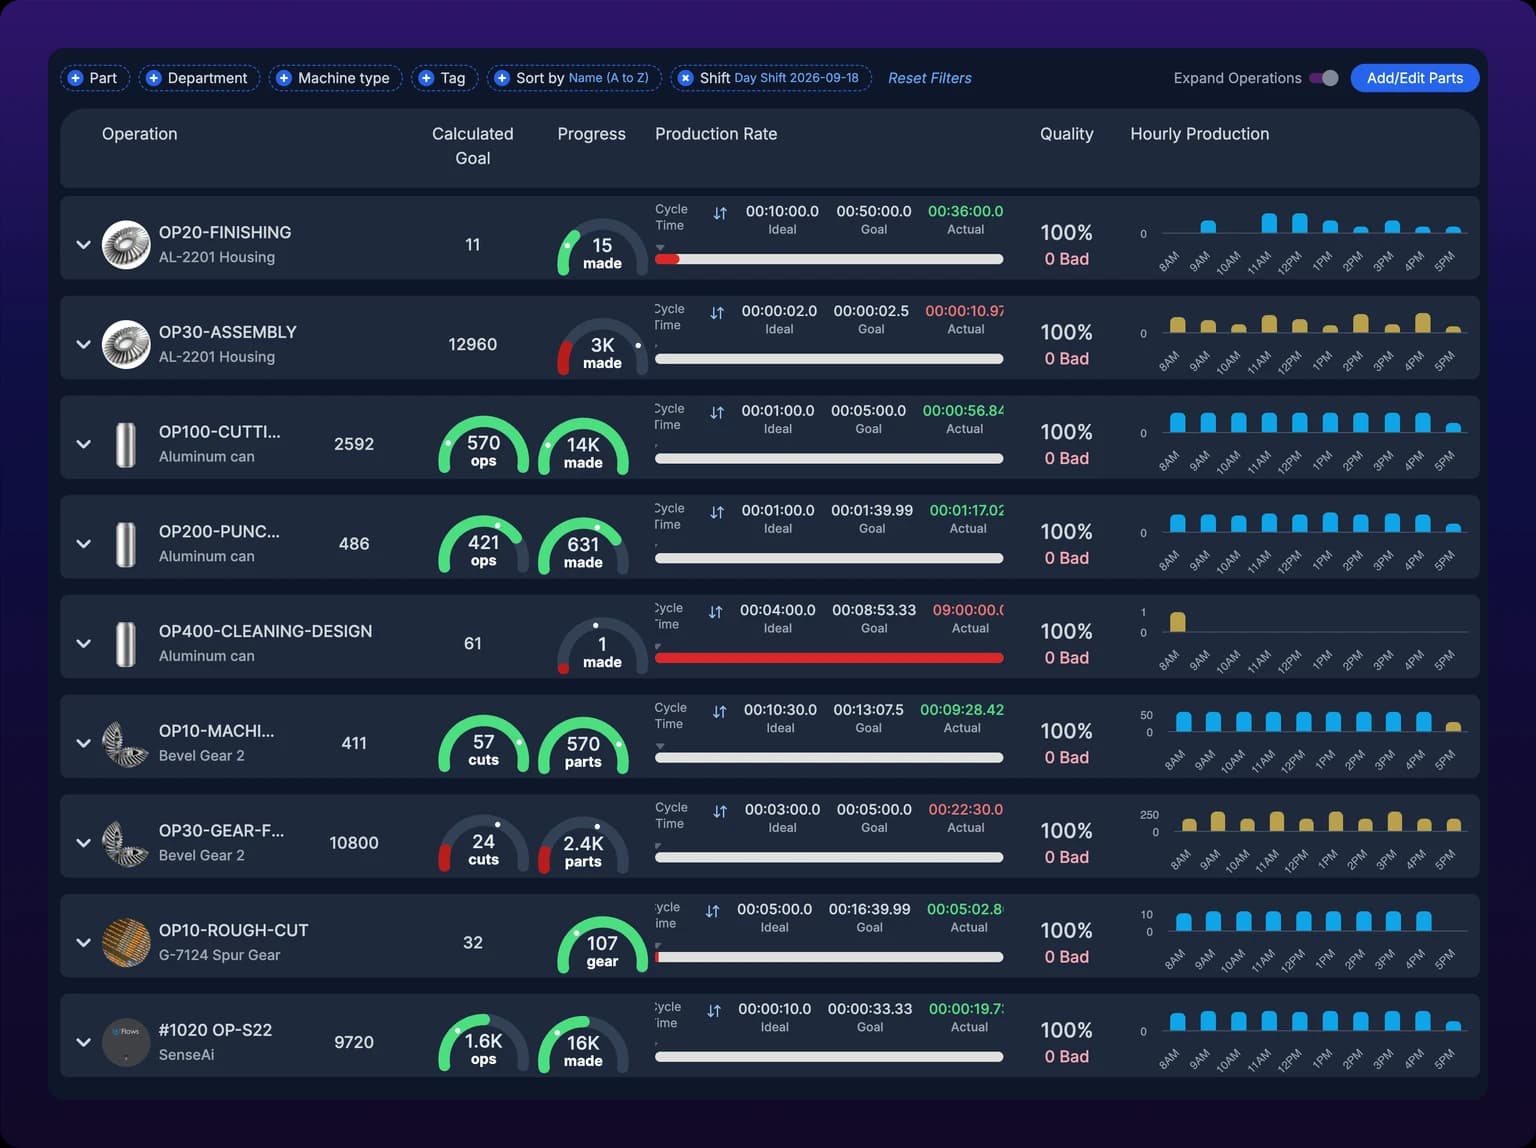
The collapse state travels in the URL alongside the filters, as operations_expanded and assets_expanded, so the screen opens the way your browser looked.
The board has no refresh timer of its own. It loads its numbers when the page opens and reloads them whenever you change a filter or flip the switch, unlike the Assets page, which refreshes every minute. Reload the page to catch a browser tab up.
Where the goals come from
Two different goals color this page, and neither one is set here.
| Goal | Set on | Applies to |
|---|---|---|
| Calculated Goal, a part count | The operation's ideal cycle time in the Parts List. See Set cycle times and downtime filters | One operation, on every machine that runs it |
| OEE goal, a percentage | The organization, or one machine where you have overridden it. See Set OEE and utilization goals | Every gauge on the machine, here and on the Assets page |
The calculated goal is derived for you from the shift, not typed in:
Goal = (Shift Duration - Expected Downtime) / Cycle Time
Expected downtime is the historical average for that operation and machine, which is why a machine with a long changeover history is given a goal a lower one would not get.
Goals on this page are read-only, and there is no per-operation override. If a goal is wrong, the number behind it is wrong. Change the cycle time in the Parts List to move the calculated goal, and change the OEE goal to move the threshold the gauge is colored against. Both recalculate on the next load.
To reach the cycle time from here, select Add/Edit Parts at the top right, then edit the operation's ideal cycle time. Goals recalculate for future shifts; the shift already under way keeps the goal it started with.
When a number looks wrong
| Symptom | Cause | Fix |
|---|---|---|
Calculated Goal reads 0 | The operation has no ideal cycle time | Set one in the Parts List. See Set cycle times and downtime filters |
| "There are no parts in production for this shift." | Nothing has been counted in the selected window | Check the Shift filter before you check the machine. A named shift that ended hours ago shows the shift, not today |
| The count does not match the hand count on the floor | The operation's detection algorithm is reading the signal wrong | See Troubleshoot inaccurate part counts and Choose a production tracking algorithm |
| Quality reads 100% with scrap in the bin | Scrap counts only once it is logged against the job | See Log scrap and manage scrap reasons |
| An operation is behind but every machine row looks fine | The operation is split across machines and no single one is far off | Read the hourly bars rather than the totals. One amber hour on each of three machines is the same lost shift |
| The numbers have not moved in an hour | The page loaded before those parts were counted | Reload. The board has no timer, see Put the board on a TV |
Use this board for the shift in front of you. To compare one shift against last week, or to export the counts, go to Compare production over weeks and months: Shift Production itself has no export.
See also
From the blog
- How to know mid-shift whether you will hit targetCompare the count with the goal to now, project the shift at its current pace, and use the stop budget to see whether a gap can still be recovered.
- How to set ideal cycle time, and what it does to OEEThe ideal cycle time sets OEE performance and the shift goal. Learn who should own it, how to time it, and what a 10% error does to every number built on it.
Set up part counting on a line whose output is units moving past a point: bottles, cans, packets, tubes, cartons or cases. Mount a BeamTracker across the part path after the last reject point, set the operation's algorithm to Counter, name the unit in OP UNIT so gauges read bottles/min, and set QTY/OP to 1 when the beam sees each unit or to the pack count when it sees a case. A Counter operation's cycle time feeds goals and the rate, never the count, and the downtime filter lives on the device in seconds rather than on the Parts List as a percentage. The Count tab of the Auto-Detect modal is single choice, so the line carries one operation at a time and you re-pick it at every product change.
Historical, at /production?select=historical_report, charts good parts and scrap across days, weeks, months, quarters or years, then breaks the total into one card per operation and one row per machine that ran it. Every Last N preset ends at the last completed period, so this week never competes with a full one. Show Scrap adds a second red column beside each period's good column, and only scrap logged against a job reaches it. Actions downloads the view as CSV or a server-rendered PDF, or emails it now or on a cadence.