

Compare production over weeks and months
Put this week's output next to the last eleven, operation by operation and machine by machine.
Historical is the report you open once the shift board has told you something is off. It charts good parts and scrap across a range of days, weeks, months, quarters or years, then breaks each period's total into one card per operation and one row per machine that ran it.
Nothing here is editable. It is a report rather than a board, and it is the only production surface that produces a file.
Before you start
- Create parts and operations and assign them to machines, so there are counts to chart. See Create parts and operations.
- Log scrap against jobs if you want the scrap half of the chart to hold anything. See Log scrap and manage scrap reasons.
There is no role gate. Anyone who can see a machine can read its production history.
Open the report
Open Production, then the Historical tab, at /production?select=historical_report.
It opens on Last 7 days at a daily interval. A line under the toolbar names the time zone every date on the page is calculated in: your organization's, not your browser's. See Shifts and time zone.
Choose the interval and the window
The date button at the right of the toolbar sets both at once. Pick an interval down the left of the panel, then a preset or Custom range on the right, then Apply. The interval is the width of one column in the chart.
| Interval | Presets | One column covers |
|---|---|---|
| Daily | Last 7 days, Last 14 days, Last week (Mon - Sun) | One day |
| Weekly | Last 4, 6, 8 or 12 weeks | One week, Monday through Sunday |
| Monthly | Last 3, 6, 9 or 12 months | One calendar month |
| Quarterly | Last 2, 4 or 8 quarters | One calendar quarter |
| Yearly | Last 2, 3 or 5 years | One calendar year |
Every Last N preset ends at the most recent completed period. Last 4 weeks is the four finished weeks before this one, and leaves the week you are in out of the chart. That is what keeps the comparison fair: a Tuesday-afternoon week never competes with a full one.
Compare weeks rather than days when the part mix changes. A day-to-day comparison across a changeover measures the changeover. A weekly column absorbs the setup, and what is left is the thing you wanted to see.
A Last N preset writes last_n_cycle into the address bar and no fixed dates, so the link stays rolling: it counts back from the day it is opened rather than naming two dates. Custom range, and Last week (Mon - Sun), write from and to instead, which freezes the window. Only a rolling link can be scheduled, see Schedule a recurring report.
Read the chart
The chart across the top is the whole organization. One column per period, stacking every operation that ran in it, one color each.
Hover a column for a shared tooltip listing each operation's count for that period, with Total Good beneath them. Drag sideways across the chart to zoom into part of the range. There is no legend: the operation names are in the tooltip and in the cards below.
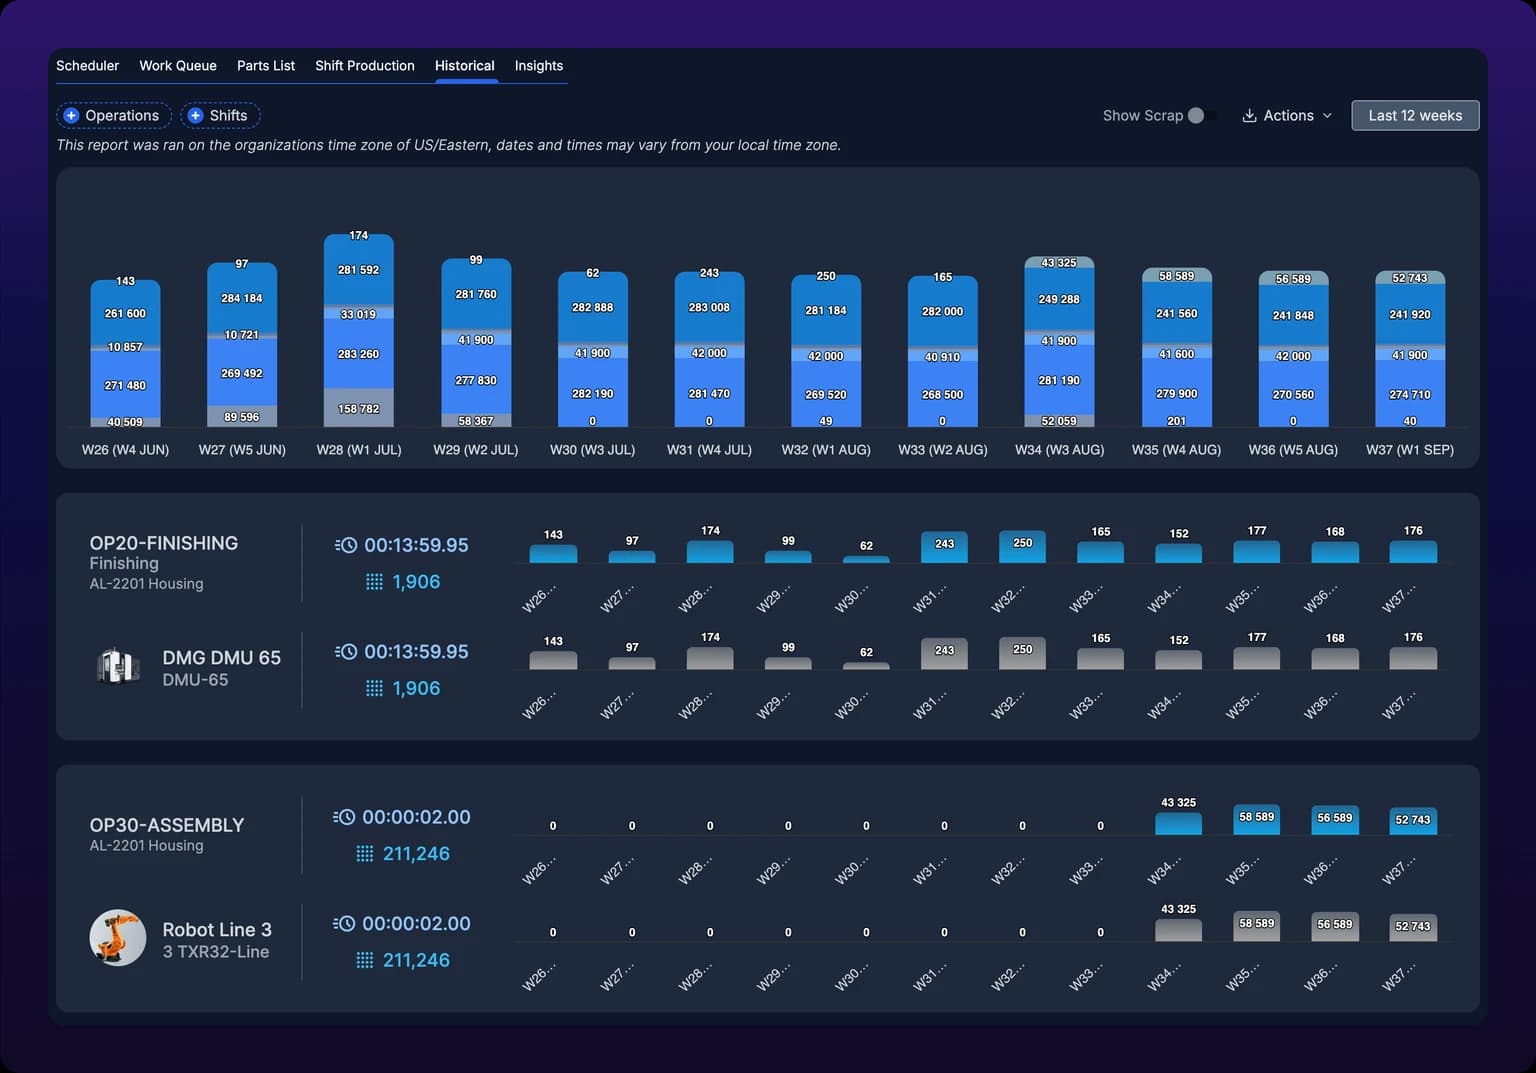
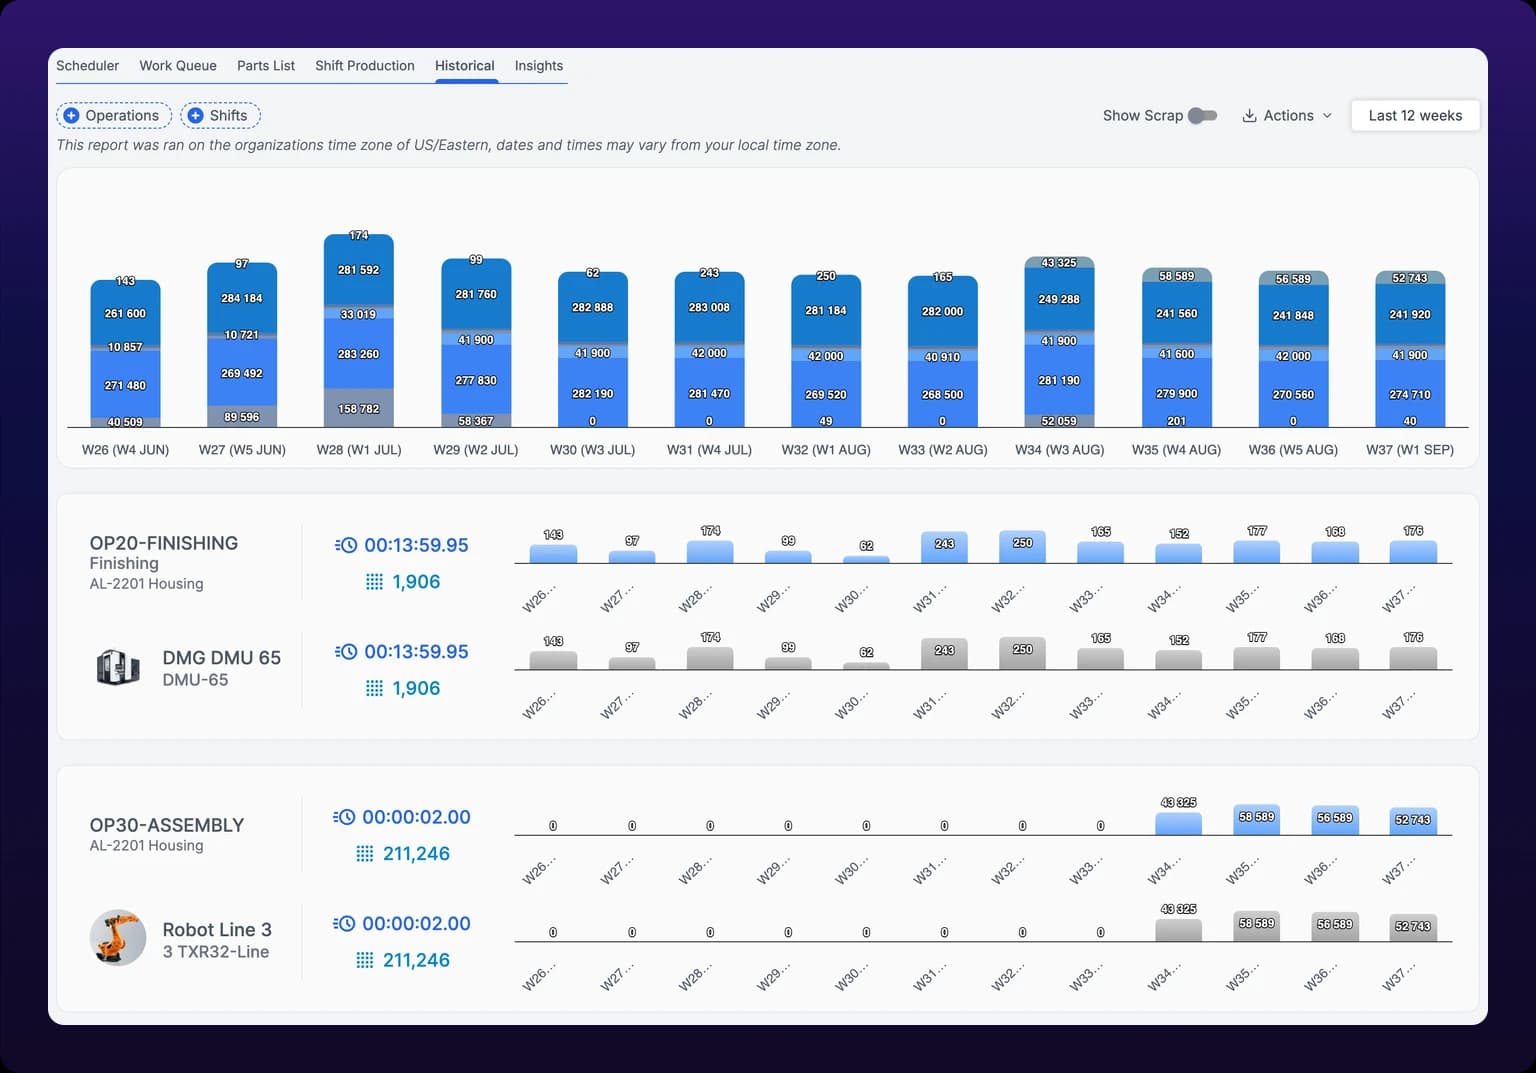 Historical production by week. Each column stacks the operations that ran in that week.
Separate good parts from scrap
Scrap is hidden until you ask for it. Set Show Scrap, to the left of Actions, and a red column appears beside each period's good column.
Scrap does not sit on top of good parts, it stands next to them. So a period with scrap reads as two columns, made and rejected, and the tooltip gains a Total Bad to go with Total Good. The same toggle adds the red series to every operation card and machine row below.
Only scrap logged against a job reaches this chart. A part thrown in the reject bin and never recorded is invisible here, and it is still counted as good everywhere else. If the red column is missing on a week you know went badly, check that scrap was logged before you check the sensor. See Log scrap and manage scrap reasons.
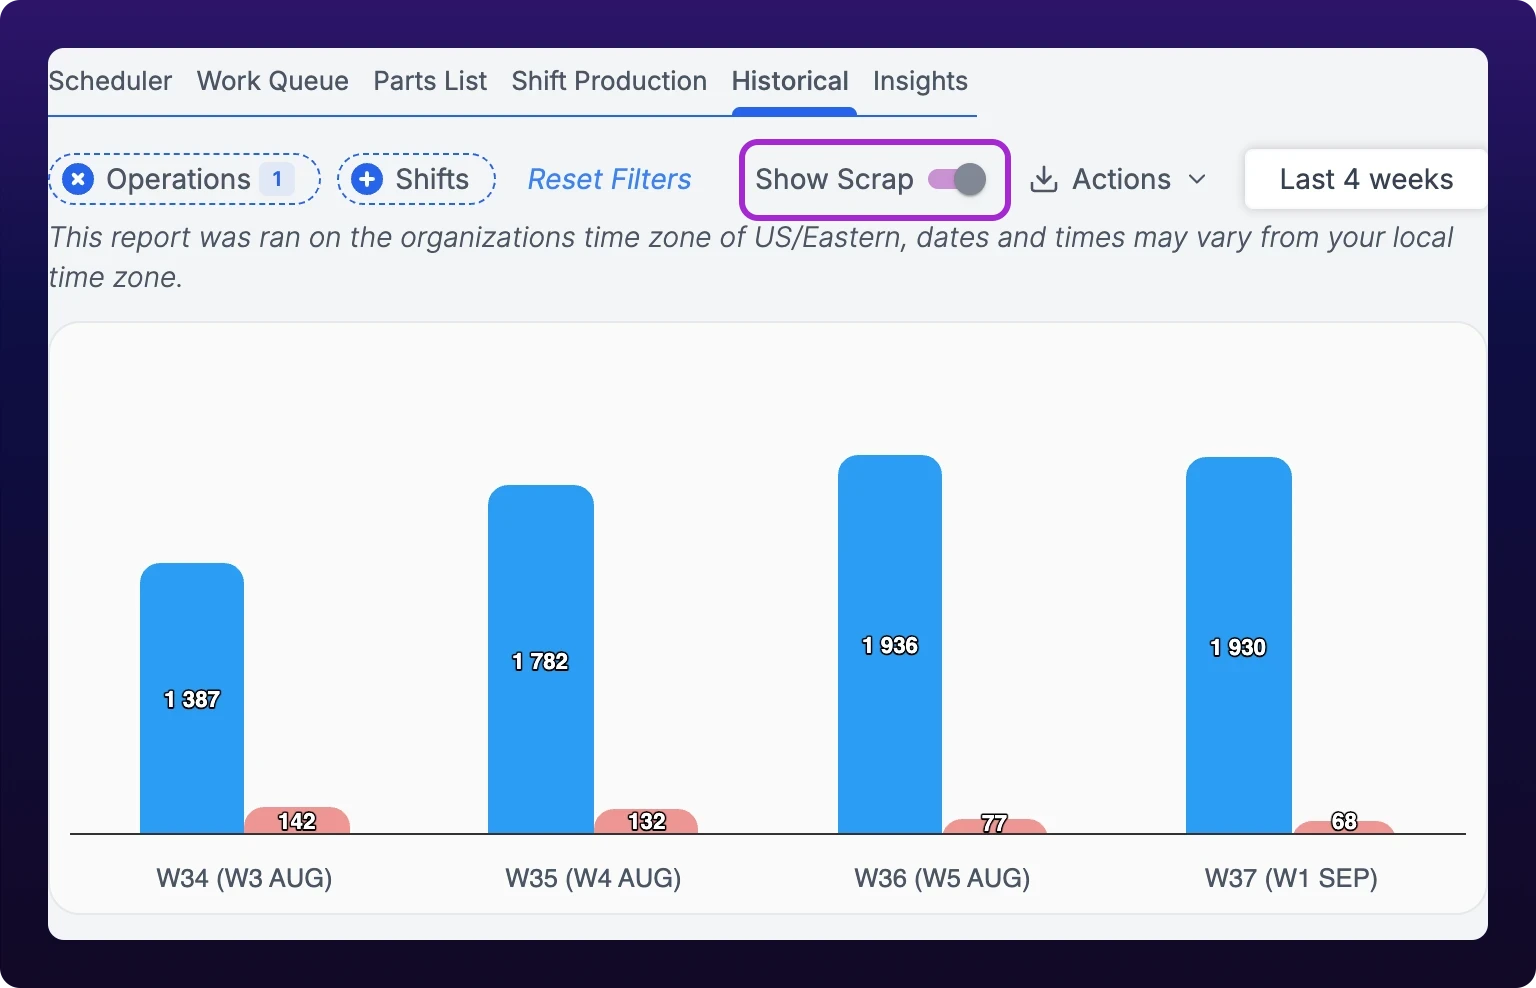 Show Scrap on. A red scrap column joins each period's good column.
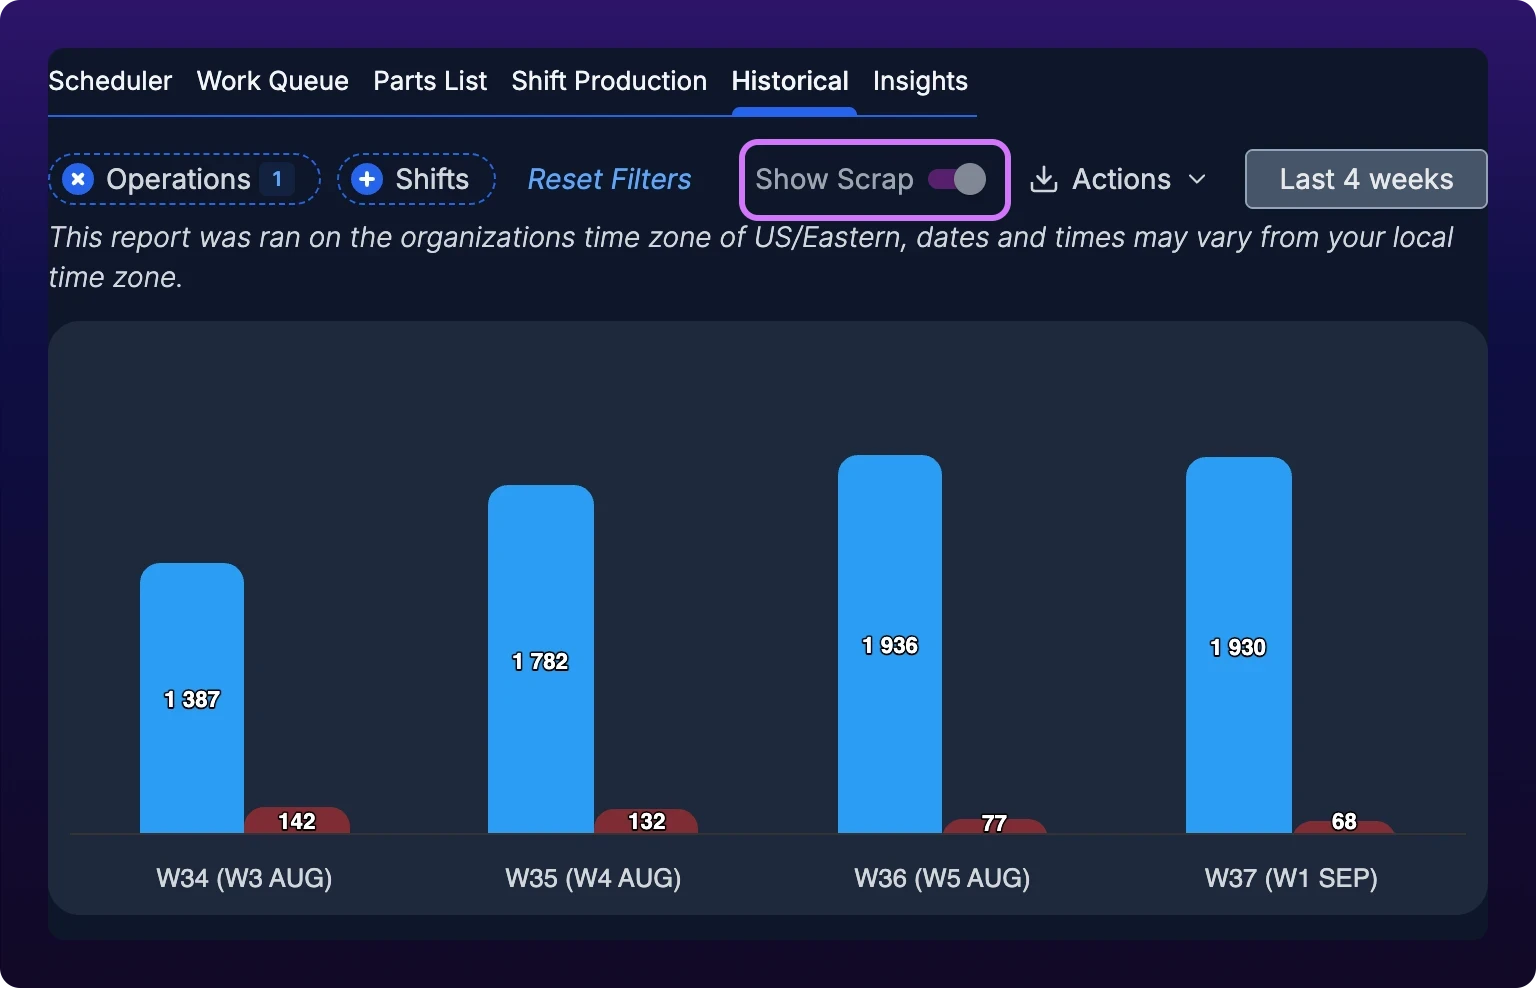
The toggle travels in the address bar as toggle_show_scrap, so a link you send opens with scrap showing.
Read the operation cards
Below the chart, one card per operation. Each names the operation, its description, and the part it produces, for example OP10-MACHINING over Bevel Gear 2, then carries two figures and its own bar chart over the same periods.
The two figures are marked with icons rather than labels. The clock is the cycle time; the grid of dots is the good count for the window.
Inside the card, one row per machine that ran the operation, with the machine's picture, its name and its custom identifier, the same two figures, and the same chart drawn in gray instead of blue.
This is where a flat total comes apart. An operation that held steady all quarter can hide one machine that fell off in week 9 and a second that covered for it. Read the machine rows whenever the operation total looks fine and the floor disagrees.
Filter by part, operation, and shift
Two filters sit at the left of the toolbar, with Reset filters after them.
| Filter | Values | Effect |
|---|---|---|
| Part / Operation | Every part in the organization, expanding to its operations, multi-select, with a search box | Limits the chart and the cards to the operations you check. Checking a part checks all of its operations |
| Shifts | All Day (24/7), All Shifts, or any named shift, multi-select | Counts only parts made inside the shifts you check |
All Day (24/7) counts everything in the window, including parts made outside every named shift. All Shifts counts only the hours your named shifts cover. Use All Shifts when an unattended weekend would otherwise flatter or spoil the comparison, and All Day (24/7) when you want the plant's whole output.
Reset filters clears both filters and keeps the date range.
This report has no Shift islands toggle, so a shift that crosses midnight is always split at midnight here: parts made after midnight are counted on the next day. Compare a night shift day by day on the Advanced Report instead, which can report the shift whole, or widen the interval to weekly so the split falls inside one bar. See Where the overnight hours land.
Export, share, or schedule the report
Actions, at the right of the toolbar, holds four items under a Report actions heading.
| Action | What you get |
|---|---|
| Download as PDF | A server-rendered copy of the report as you have it on screen. It takes a few seconds, and leaving the page cancels it. The file is named for the window on a custom range, Production_Historical_Report_2026-06-29_to_2026-09-20.pdf, and for today's date on a Last N preset |
| Download as CSV | One row per operation, per machine, per period, named Production_Historical_Report.csv. Columns in Historical production CSV |
| Share | Emails the view you built to members of your organization now |
| Schedule | Saves the view and emails it on a cadence from daily to yearly |
The PDF is rendered from the URL you are on, so it carries your filters, your date range and the Show Scrap state, and it looks like the page. The CSV carries the rows and nothing else. See Choose CSV or PDF.
Share and Schedule are not downloads, and neither takes a typed email address: both pick from your organization's member list. See Email a report and schedule it to repeat.
You do not need this page to know whether the shift in front of you will hit its goal. Shift Production carries the live counts, the goals and the hourly bars for the shift under way. Historical exists to compare finished periods, and to produce the file. See Track production against shift goals.
When a number looks wrong
| Symptom | Cause | Fix |
|---|---|---|
| The chart is empty and no operation cards appear | Nothing was counted in the window, or the Part / Operation filter excludes everything that was | Select Reset filters, then widen the date range before you suspect the machines |
| A week is short and you know it was not | The comparison includes a period the plant was down, or the Shifts filter excludes the shift that ran | Check the Shifts filter first. All Shifts drops any hour outside a named shift, including an unattended weekend |
| Scrap is missing from a period | Scrap for those parts was never logged against a job | See Log scrap and manage scrap reasons |
| The counts do not match the hand count on the floor | The operation's detection algorithm is reading the signal wrong | See Troubleshoot inaccurate part counts |
| The dates are a day off from your own calendar | The report runs in your organization's time zone, which the line under the toolbar names | See Shifts and time zone |
| A night shift's first day is short, and the day after the shift ended has parts on it | The shift crosses midnight, and this report always splits it there | Read the run weekly instead of daily, or compare the hours on the Advanced Report. See Where the overnight hours land |
| Failed to download CSV. Please try again. | The browser could not build the file from the rows on screen | Wait for the cards to finish loading, then download again. See Export errors |
| Something went wrong generating the PDF. | The server could not render the report URL | Try again, then narrow the range. A long window at a fine interval is the usual cause |
| The + button in the Schedule dialog is grayed out | The date button is on a custom range or Last week (Mon - Sun), which are fixed windows | Pick a Last N preset and select Apply. See Schedule a recurring report |
See also
Shift Production, at /production?select=part, lists every operation that has run this shift with its calculated goal, good count, pace and hourly bars, and expands each operation into one row per machine. The Progress gauge is green at or above the machine's OEE goal and red below it, with no orange. Goals here are read-only: the calculated goal comes from the operation's ideal cycle time in the Parts List, and the percentage that colors the gauge comes from the OEE goal. Six filters write themselves into the URL, which is what makes the board sendable to a TV.
Insights, at /production?select=insights, prices scheduled work at two hourly rates you type in: Labor $/hr and Production $/hr, defaulting to $35 and $50. It multiplies each task's labor hours and machine hours by those rates, compares the result with the Budget typed on the task, and reports completion, on-time, cost, profit and margin across a date range that opens on the last 90 days. The rates live in the report and are never saved to your organization. A task with no due date counts as on time, and an Approved task counts as neither Completed nor Active.