

Monitor your fleet on the Assets page
See what every machine is doing right now, and which ones need attention.
An asset is one monitored machine: a catalog model, your own name and identifier for it, and the sensor that reports on it. The Assets page draws every asset in the organization at once, updates as sensors publish, and is the page most operators and supervisors leave open all shift.
Prerequisites. Signed in, with at least one machine reporting. Contact IoTFlows to tie your sensors to an asset, see Get support.
Open the Assets page
Go to Assets. The page opens at /assets?select=overview.
Machines you are not granted access to never appear here. So do machines hidden from the Edit Assets list, which stay editable but are drawn out of the fleet view.
How the fleet is drawn depends on the view mode you last chose, see Choose a view mode. Every mode shows the same machines and the same window; they differ in how much of each machine they draw.
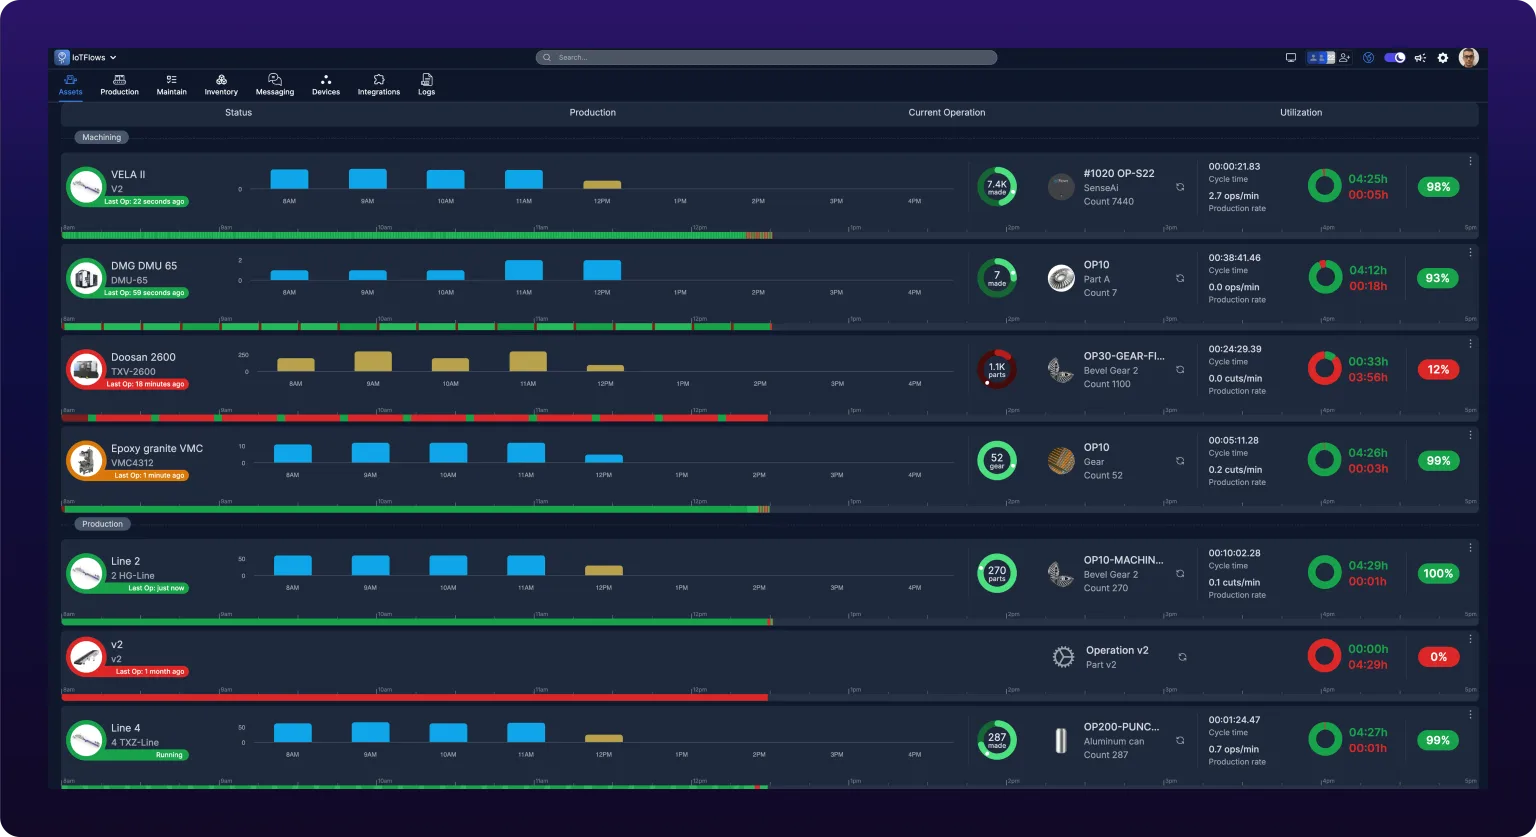
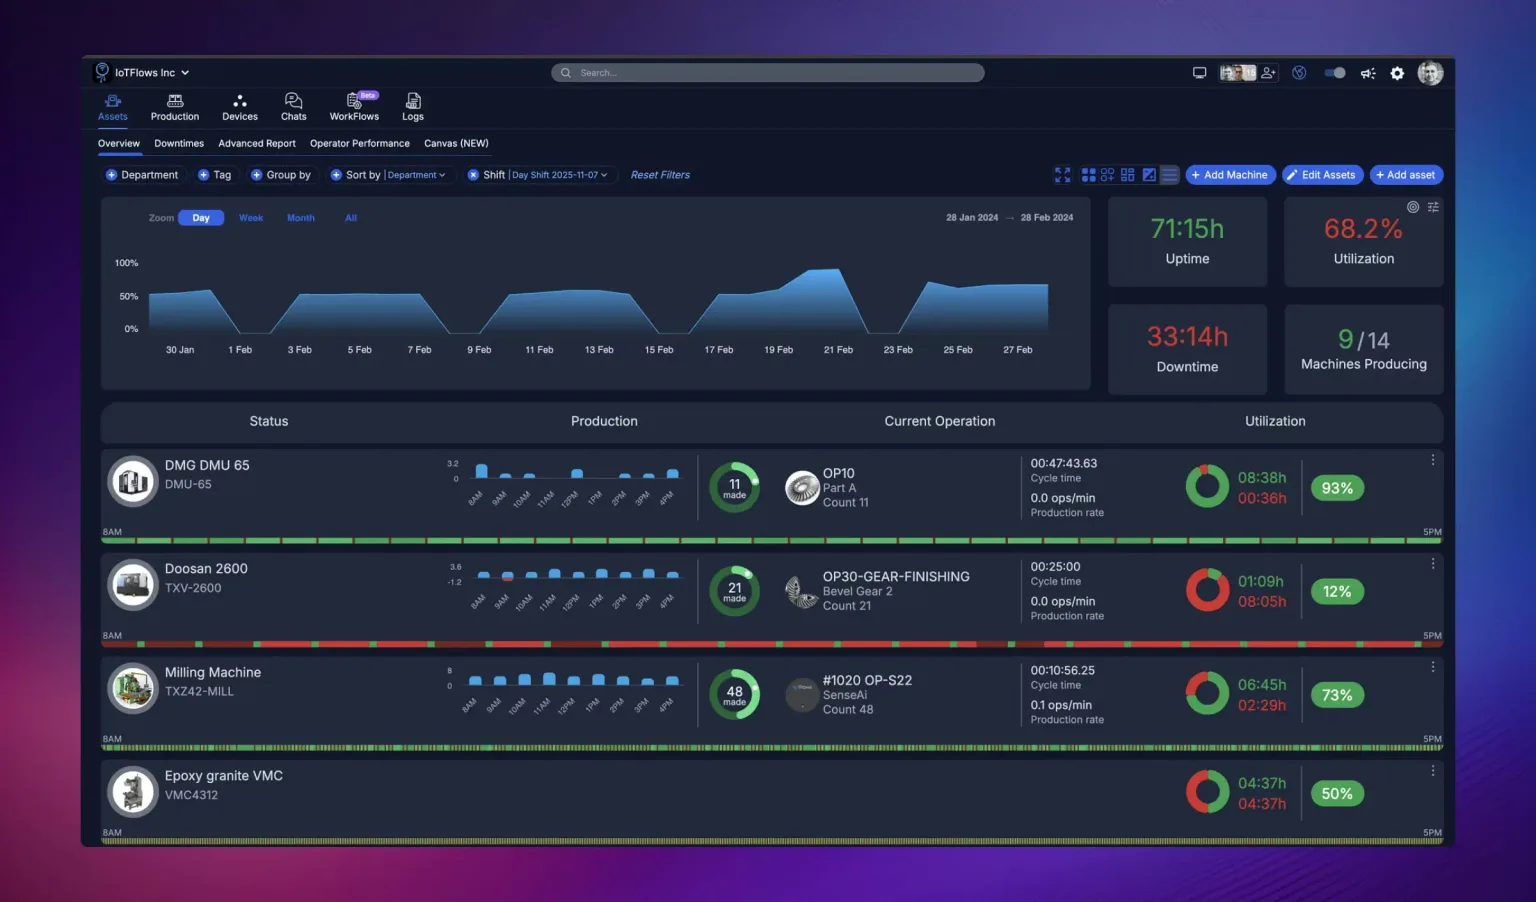 The fleet in list view, with the shift status bar under each machine. Green is running and red is down.
Read the fleet KPIs
Four tiles across the top total the whole fleet for the window you have selected.
| Tile | Shows |
|---|---|
| Uptime | Total hours every machine spent running, as 71:15h |
| Utilization | Running time as a percentage of running plus down time, green when it meets the goal and red when it does not |
| Downtime | Total hours every machine spent down |
| Machines Producing | How many machines are running right now, over the total, as 9/14 |
Two controls sit in the corner of the Utilization tile. Adjust OEE Goal sets the organization-wide goal that colors the number, see Set uptime goals. Adjust Status Colors sets the two thresholds described in Read a machine card.
Beside the tiles, a chart plots utilization over time so you can see whether this shift is normal. Zoom regroups it: Day plots the last month a day at a time, Week the last three months a week at a time, Month all your history a month at a time, and All every point ungrouped. Zoom changes only this chart, not the machine timelines below it.
Every figure on this page is defined in Metrics.
 The two controls in the corner of the Utilization tile: Adjust OEE Goal on the left, Adjust Status Colors on the right.
Read a machine card
Each card carries the machine's photo inside a colored status ring, its name and identifier, uptime and downtime for the window, an Uptime gauge against that machine's goal, hourly production against the hourly goal, and cycle time or production rate colored against the cycle-time goal.
Under the identifier, a running machine shows a Running pill. A stopped machine shows Last Op and how long ago it was, in the current status color, so the card answers "how long" without being opened.
A shift status bar runs the width of the machine, from the start of the window to its end, colored for the state the machine was in at each moment. It is the one element that shows you the shape of the shift rather than its totals: six short red stretches and one long one are the same downtime total and completely different problems.
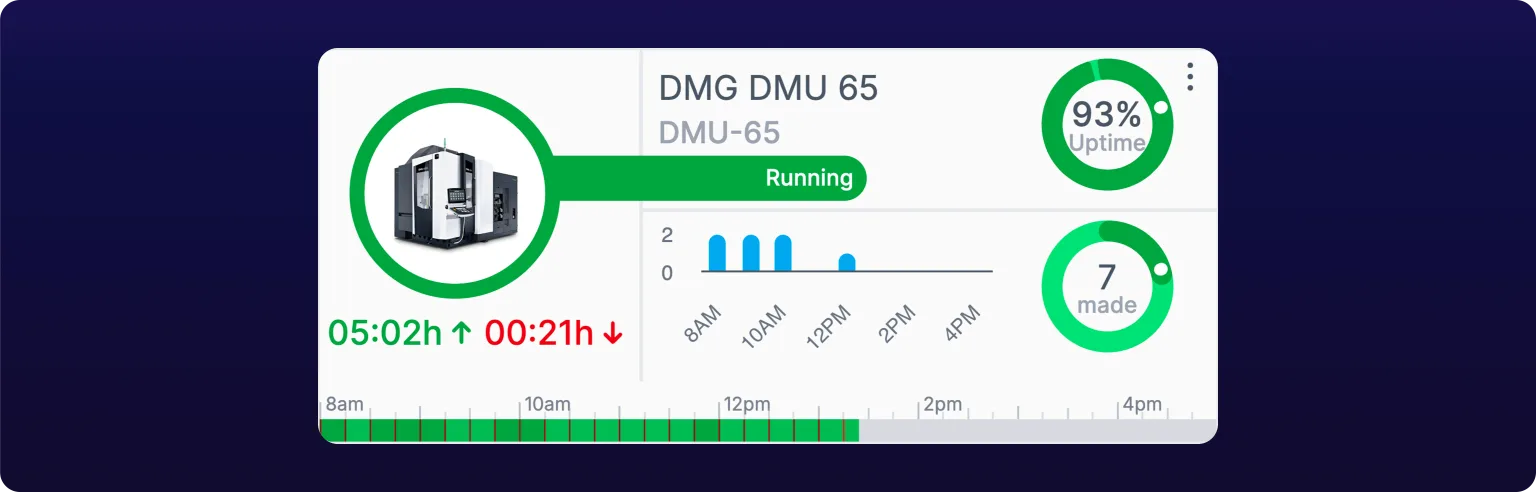 A running machine's card: green ring, Running pill, Uptime against goal, parts made, and the shift status bar.
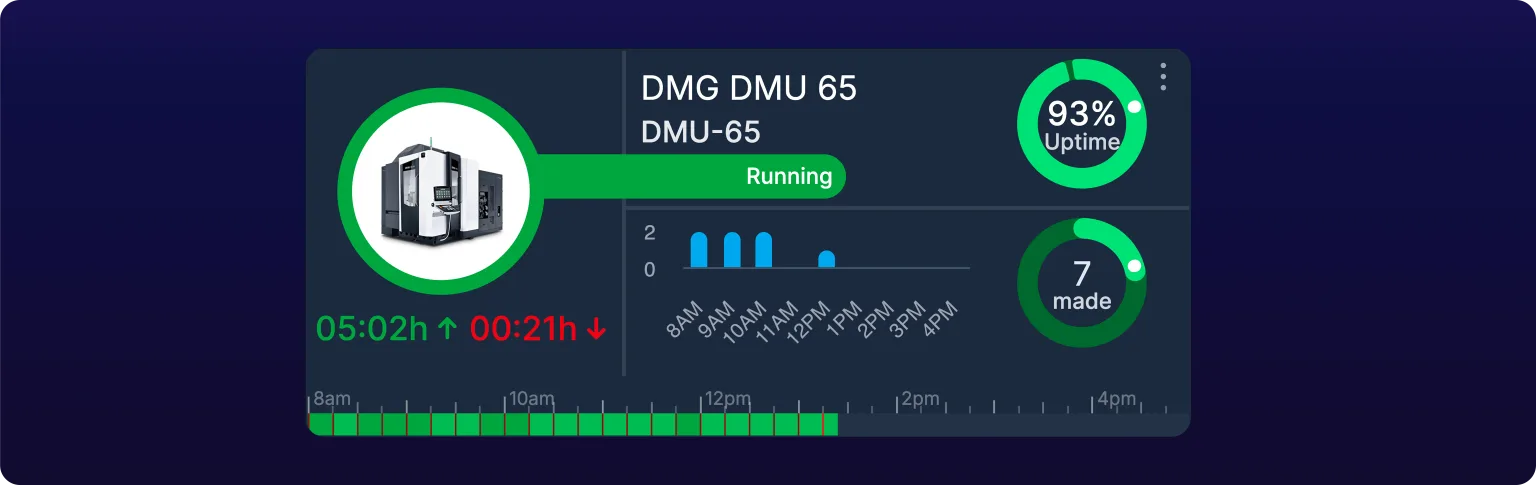
A sensor reports a machine as running or down. There is no third state. What the colors add is how long it has been down.
Status colors
| Color | Means |
|---|---|
| Green | Running |
| Orange | Down past the first threshold, one minute by default |
| Red | Down past the second threshold, five minutes by default |
| Dark red | Down, and the stop has been classified |
| Gray | No data from the sensor for that stretch |
Gray is absence of data, not downtime. A bar striped with gray through a shift is a connectivity problem, not a machine that keeps stopping, and the card still reads stopped because it carries the last state the cloud recorded. See Troubleshoot a device that is offline.
Both thresholds are organization-wide, and you set them in Adjust Status Colors. See Status colors. A classified stop skips them: it is drawn dark red from the moment it is classified, rather than working through orange first.
Dark red is only the default. Each downtime category can carry a color of its own, picked from a palette under Color when you add or edit the category. Reports and Pareto charts draw that category in its color, see Manage downtime categories.
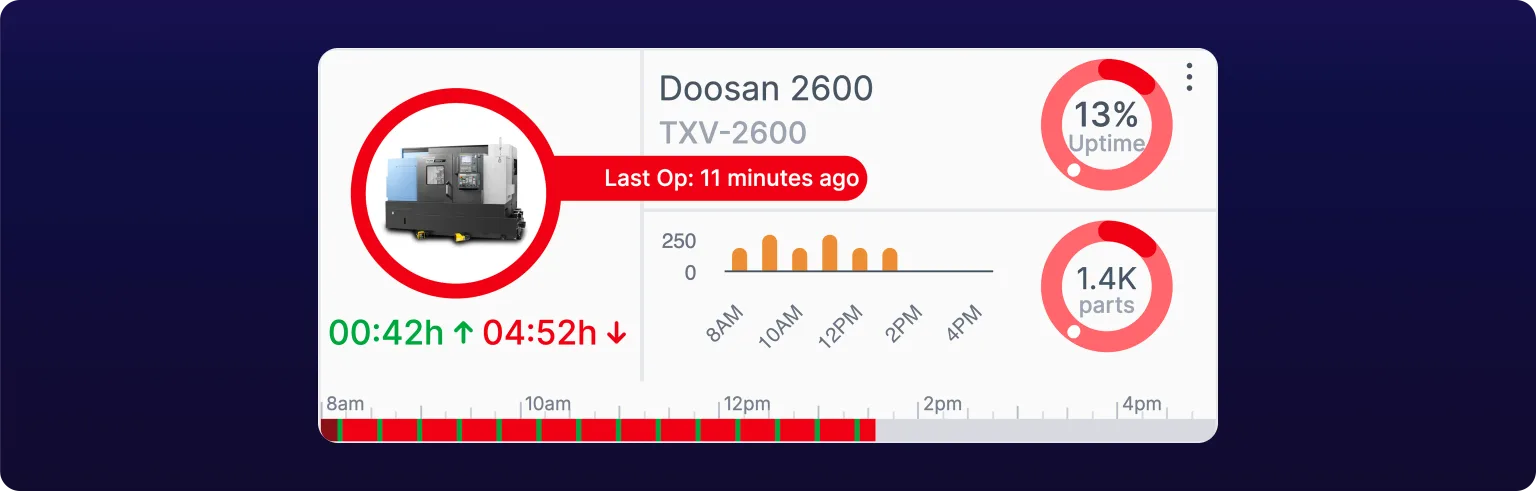 A machine stopped eleven minutes, well past the five-minute red threshold.
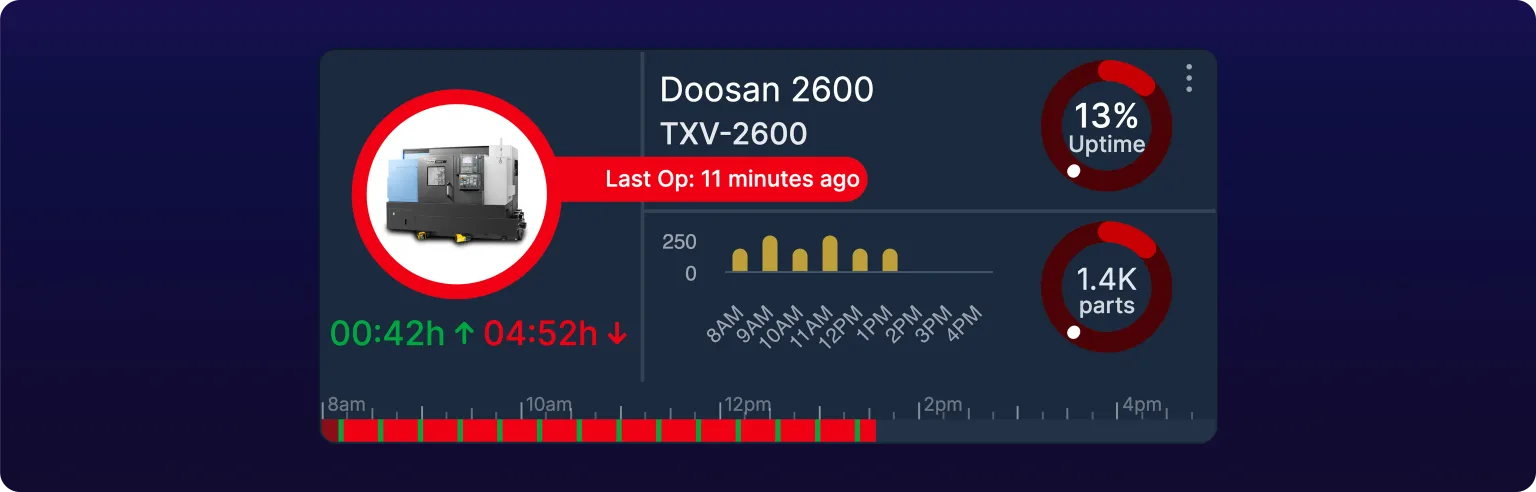
Click any card to open that machine, see Inspect a single machine.
Choose a view mode
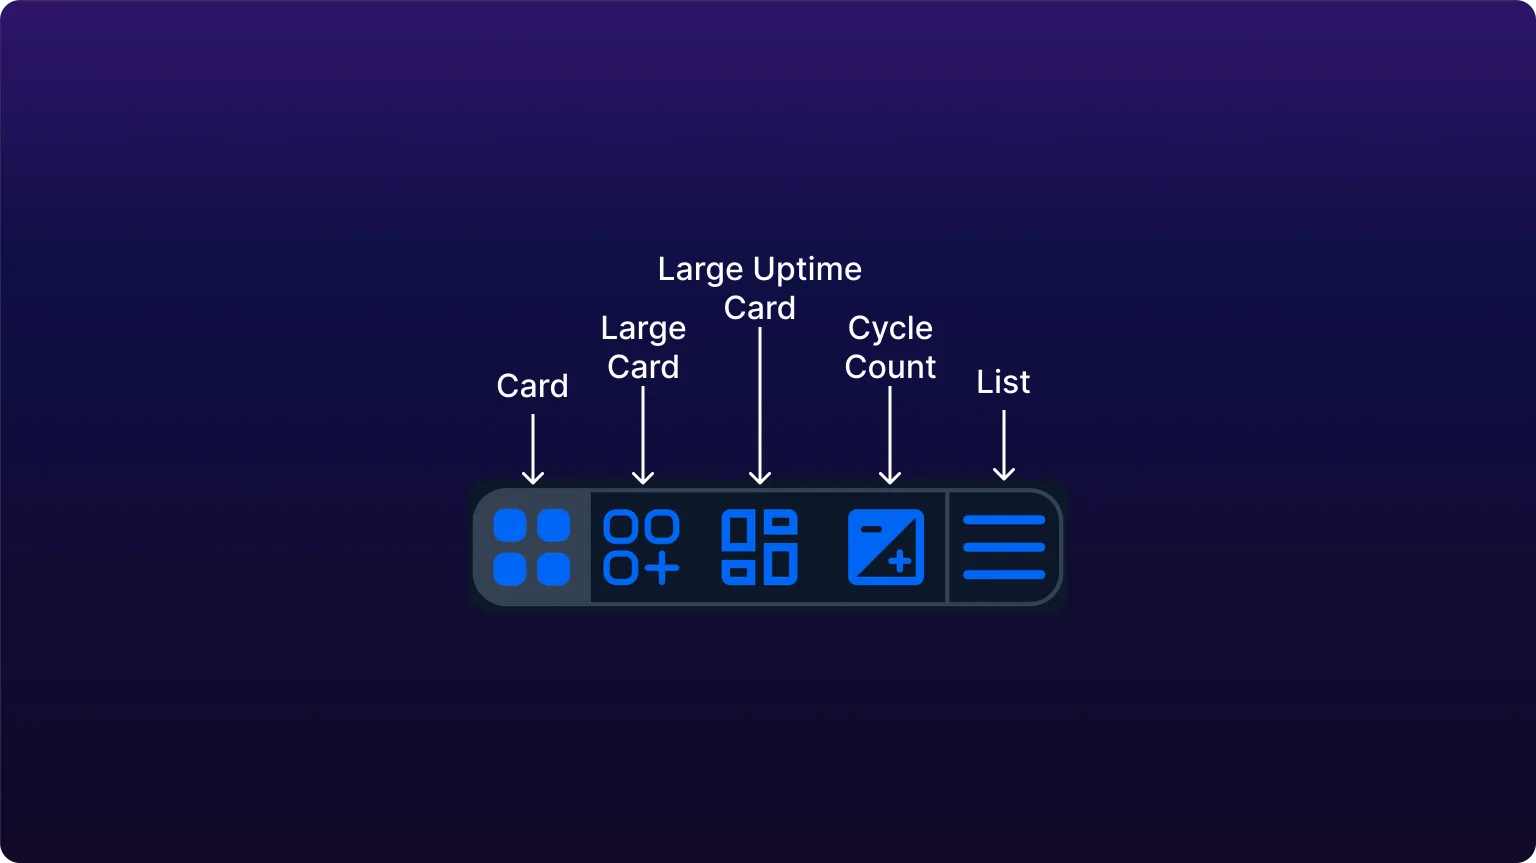
Five icons at the right of the toolbar switch how the fleet is drawn.
| Mode | Shows | Best for |
|---|---|---|
| Card | Photo, status, uptime gauge, hourly production, cycle time | The default, up to roughly 20 machines |
| Large card | The same, at a size readable across a room | A wallboard or a supervisor's second monitor |
| Large uptime card | Uptime and goal given the whole card, with first pass yield where it is enabled | Watching goal attainment rather than activity |
| Cycle count | Production counts and cycle time, other elements dropped | Count-driven work, where the number is the point |
| List | One dense row per machine | Large fleets, and scanning for anything stopped |
Choose the list view above roughly 20 machines. Card view stops being scannable at the point where you have to scroll to see the whole fleet.
Your choice is saved to your IoTFlows account, not to the browser, so it follows you to any machine you sign in on. A toast reading "View settings changed" confirms the save. On a phone, only Card and Cycle count are offered, with List added on a tablet.
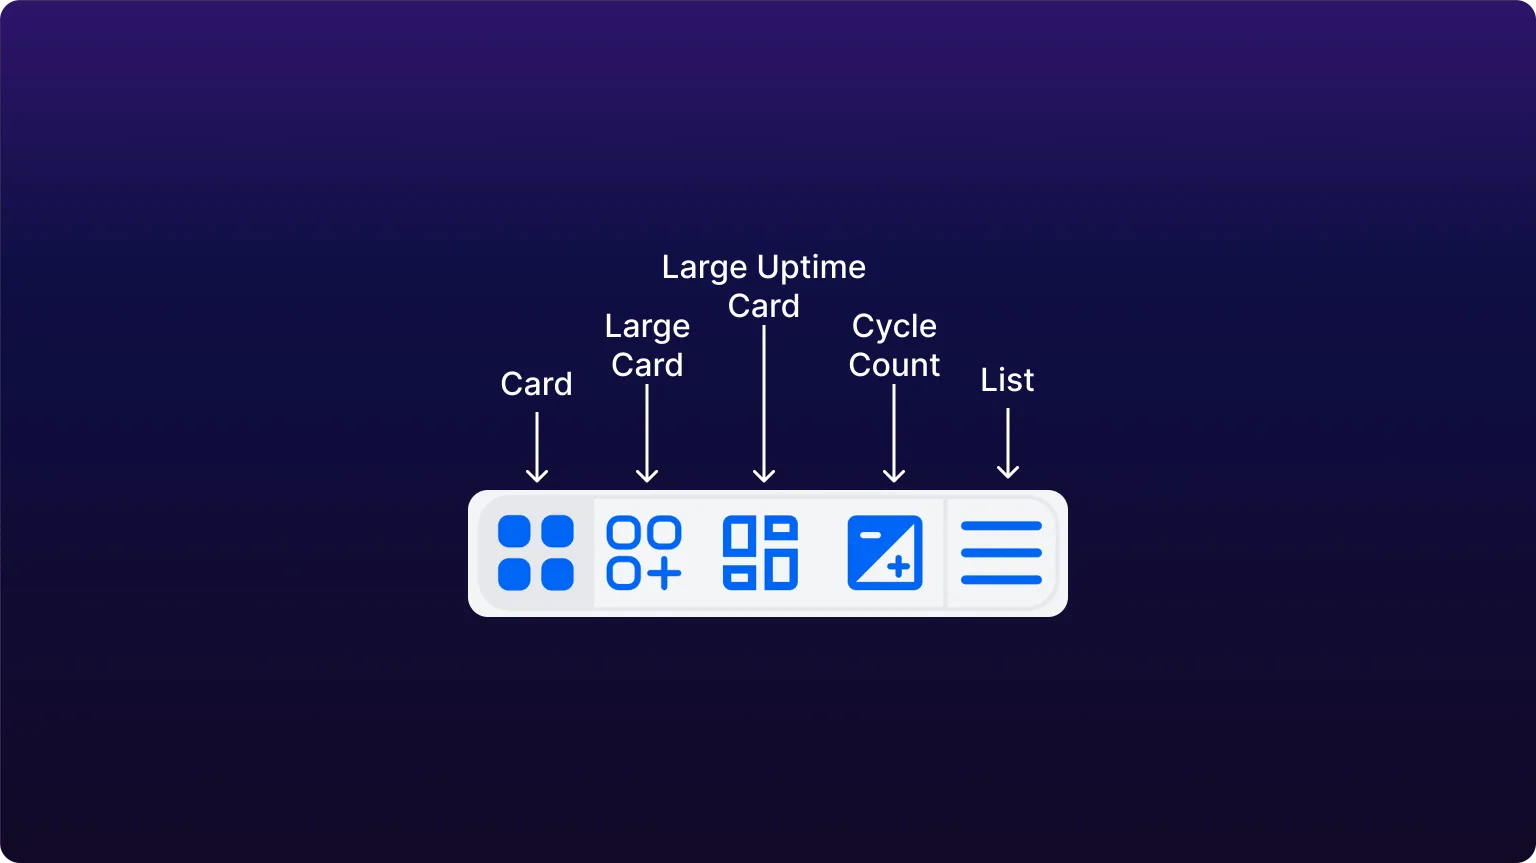 The five view modes. Your choice is saved to your account, not the browser.
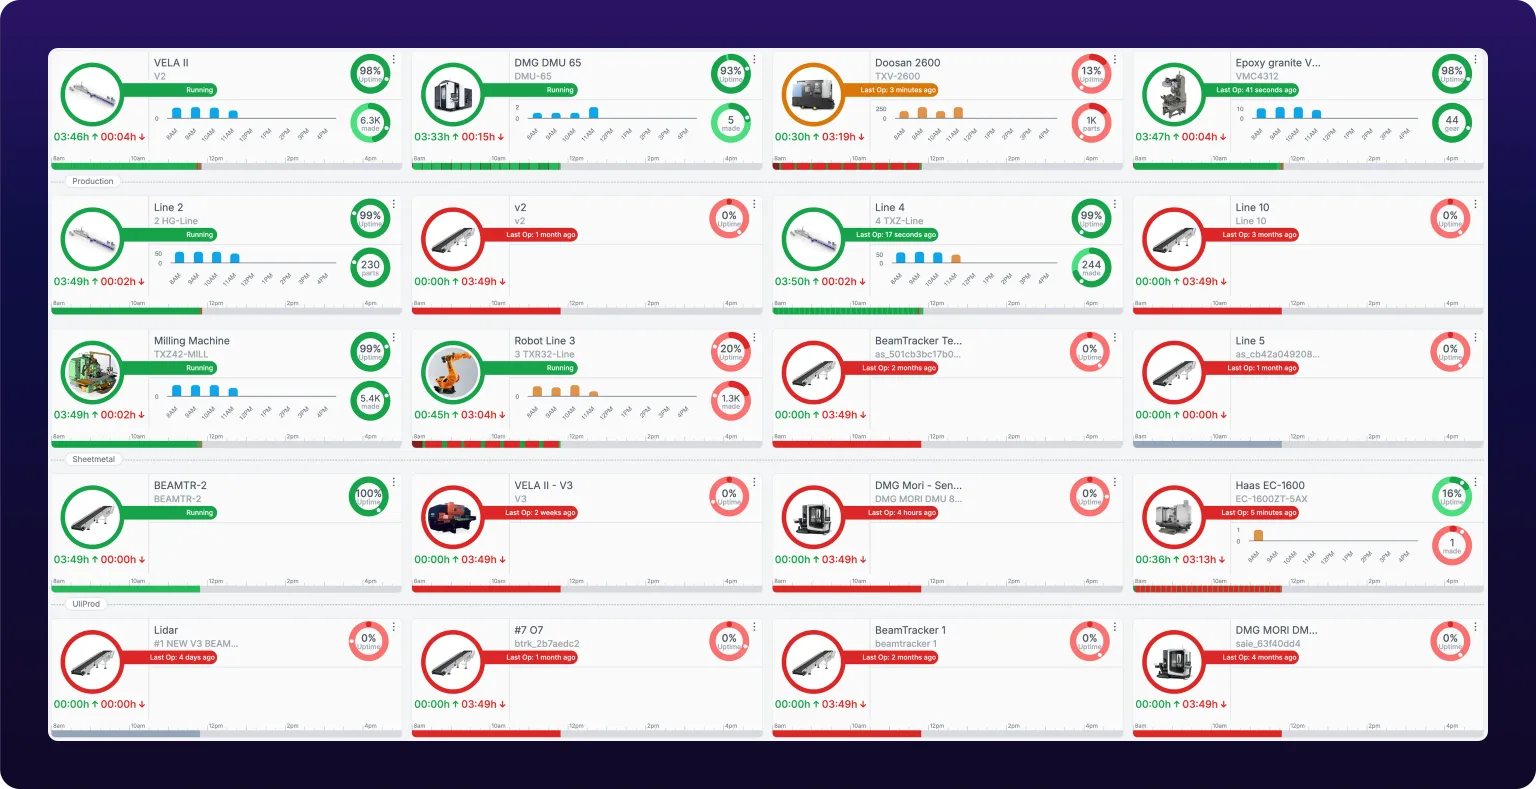 Card view at twenty machines, grouped by department. This is about as much fleet as fits before you start scrolling.
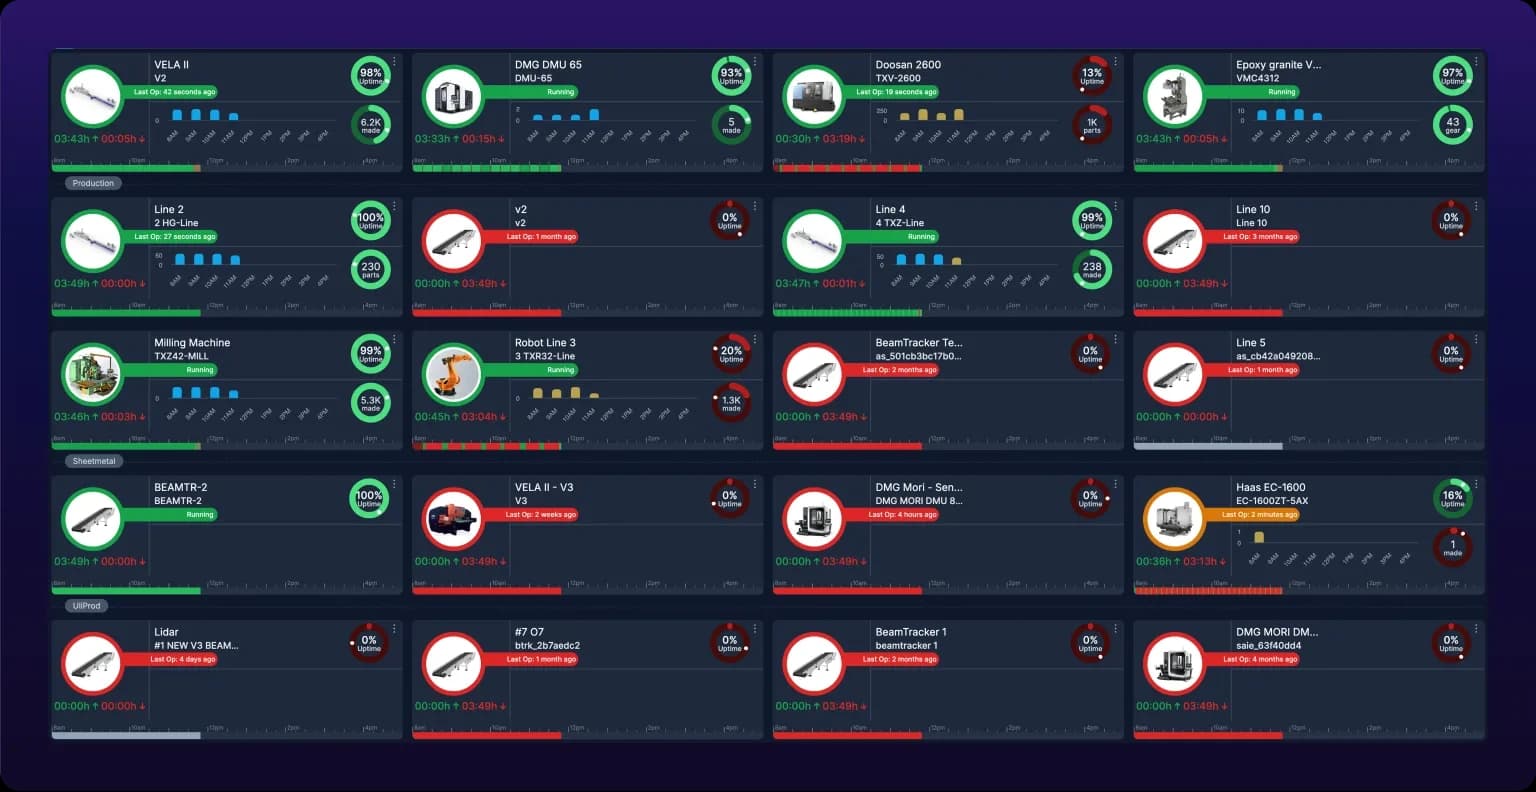
Filter the fleet
Department and Tag narrow the page to part of the fleet. A tag is a label you attach to machines yourself, for a set that crosses departments, such as CNC. Machine type filters by catalog model, and is offered only in the expanded view, which the arrows icon opens.
Every filter is held in the URL, so a filtered page is a link you can send. Reset filters clears them all.
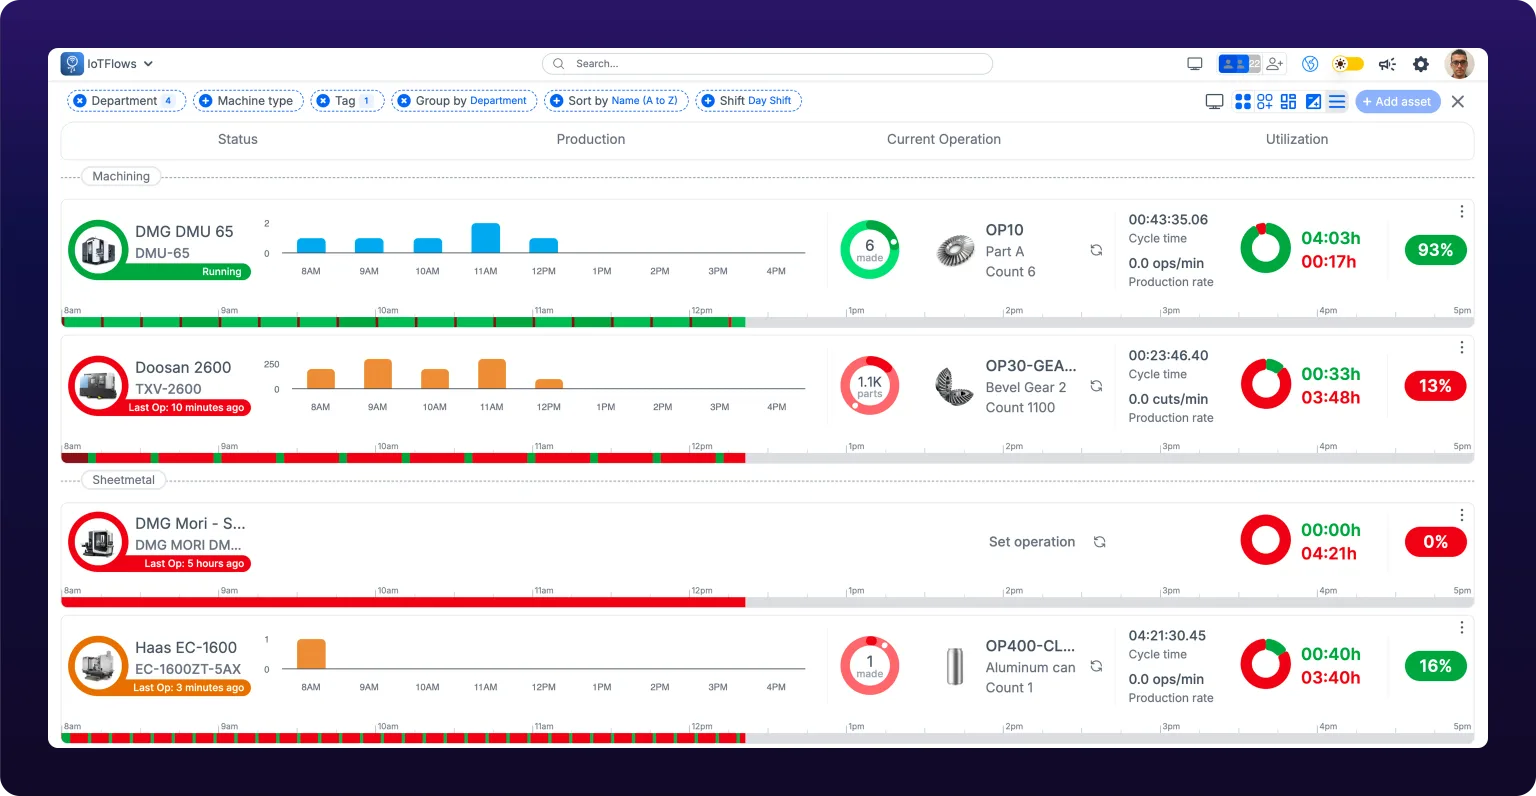 The filter bar in expanded view. Machine type appears only here, and a chip carries the number of values you picked.
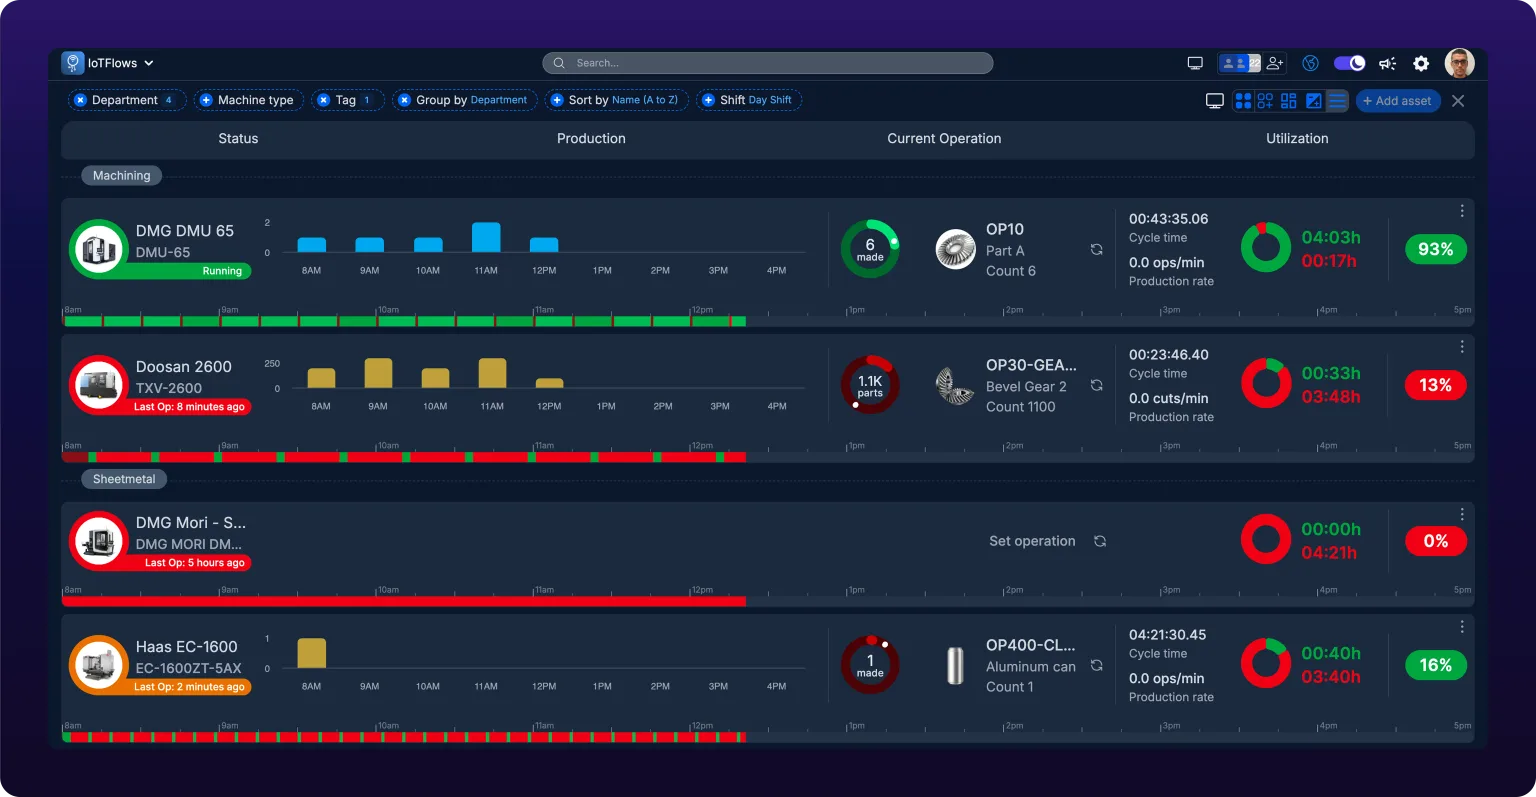
Group and sort
Group by splits the page under headings: Department, Status or Machine type. Sort by orders the machines within each group: name A to Z, name Z to A, department, or machine type.
Group by Department for everyday use: it matches how most plants are organized. Group by Status when you are working a shift and want everything stopped collected at the top. Leaving Group by unset draws the fleet as one flat run.
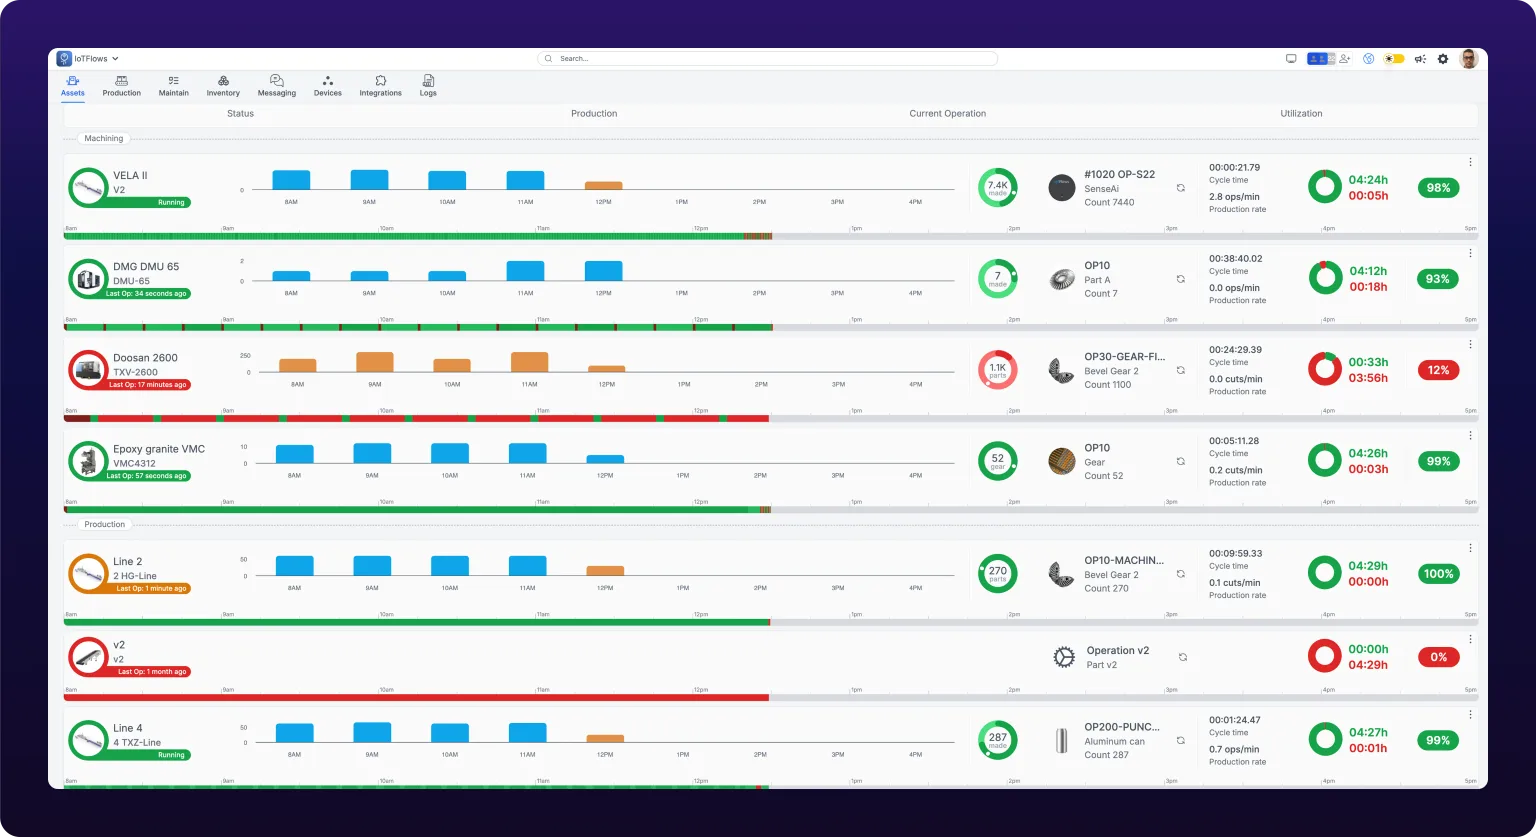 Grouping by department puts each area under its own heading.
Choose the window
Shift decides what every number on the page counts. Leaving it alone tracks the current shift live. You can also pick a named shift, All Day, or Custom Time with your own start and end in 30-minute increments, and set the date to yesterday or any past day.
The page refreshes itself every minute and redraws a card as soon as its sensor publishes. Selecting a shift or a date stops the refresh, because the window is now historical and a refresh would have nothing to add. Clear the shift filter to go live again.
A shift that crosses midnight is shown whole here. Pick Friday's 10 PM to 6 AM shift and the page counts all eight hours, with no break at midnight. Reports divide the same shift at midnight unless Shift islands is on, which is why this page and a report can disagree about one night, see Where the overnight hours land.
Shifts themselves are defined once for the organization, see Shifts and time zone.
When a machine is missing
Work down this list before suspecting the data.
- Clear the filters. A department or tag filter is the usual answer.
- Check that the machine is not hidden in Edit Assets.
- Check your machine access. A grant you do not have removes the machine from the page entirely, see Machine access.
- If the machine is on the page but gray, the sensor is not reporting. See Troubleshoot a device that is offline.
You do not need to add anything here to fix a missing machine. Add asset provisions a new machine, and that is a different task, see Add a machine.
See also
Read one shift of machine data correctly, from the four fleet KPIs on the Assets page down to a single stop. Pick the shift before the date, read the uptime, utilization, downtime and machines-producing tiles, read one machine's card and its status ring, open one stop from the machine's status bar and give it a downtime category. Needs a device online and shifts defined.
Read one machine's page at /assets/selected-asset/:id: the header's live status pill and its orange and red thresholds, the sensor tile and its Wi-Fi signal icon, uptime, downtime and the Uptime gauge against the machine's goal, then the Analytics tab's per-operation counts, Record Production for backfilling a count the sensor missed, the Uptime/Downtime and Runtime Comparison charts, the downtime Pareto and the Activity feed, notes on the Health tab, and which of the Jobs, Health and Meters tabs answers which question.