

Use Operator View on the shop floor
A full-screen machine page an operator can work a whole shift from.
Operator View is a display mode for a single machine's page. It drops the secondary navigation, enlarges every tap target, and replaces the Analytics tabs with four counters that are also tabs: Part Count, All Downtime, Jobs and Notes. Everything an operator does during a shift happens inside one of those four.
Prerequisites. A machine with a paired sensor, see Add a machine. Shifts defined, so the counters cover the right hours, see Set shifts and timezone.
Choose Operator View when a person works at one machine on their own account. Choose an operator station when the device is shared and should boot into the machine without anyone signing in, see Set up a dedicated operator station. A supervisor reading several machines needs neither: the standard machine page shows the same numbers with charts.
Turn on Operator View
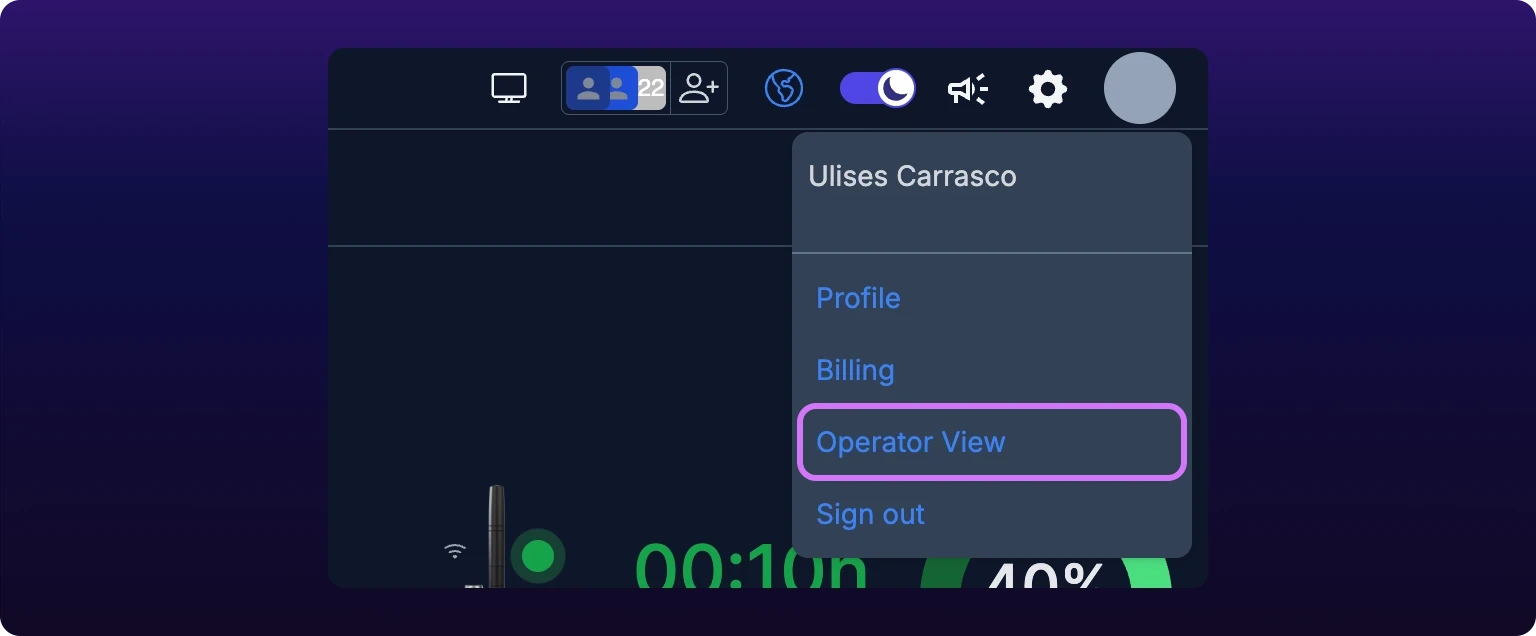
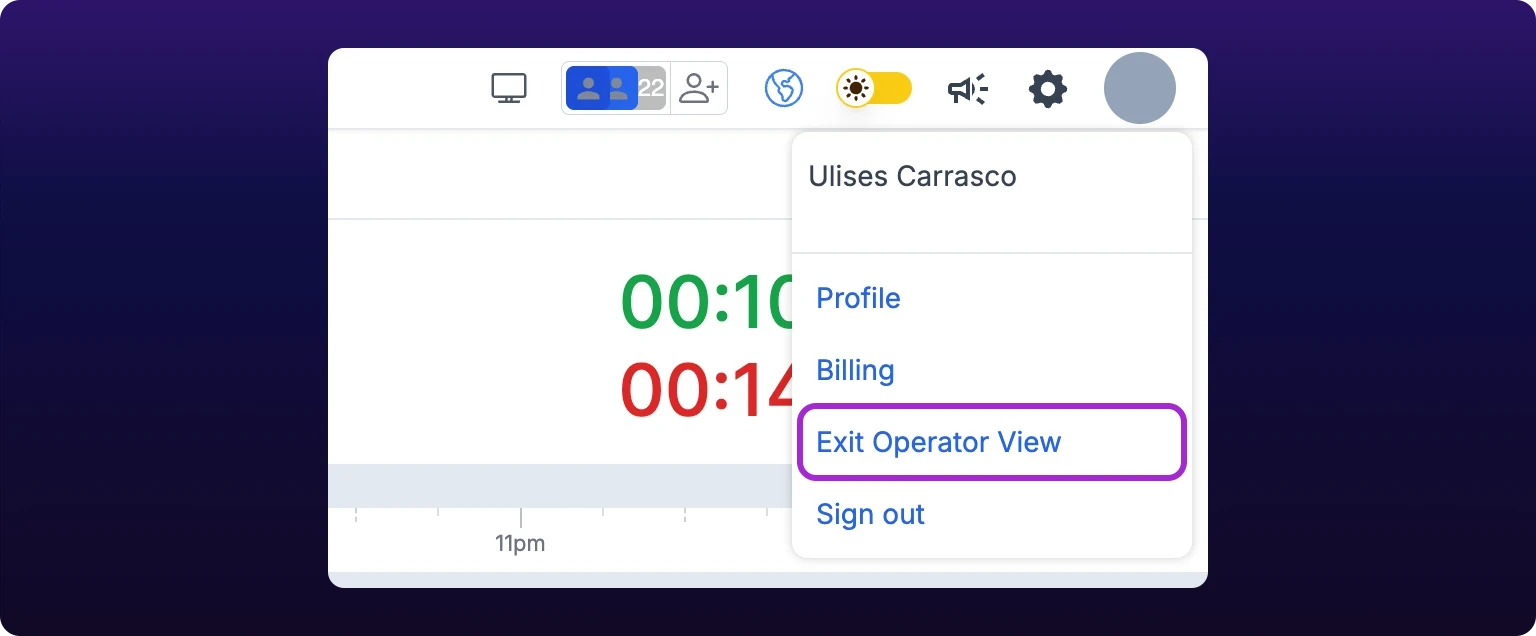
- Click your avatar at the top right of the header.
- Click Operator View. The page reloads.
- Open Assets and click the machine.
The address bar still reads /assets/selected-asset/:id, but the page renders as the operator page. The setting is stored in the browser, not on your account, so a tablet at the machine keeps it after sign-out and your desk PC is unaffected. On a phone the layout stacks, with the tab strip pinned to the top as you scroll.
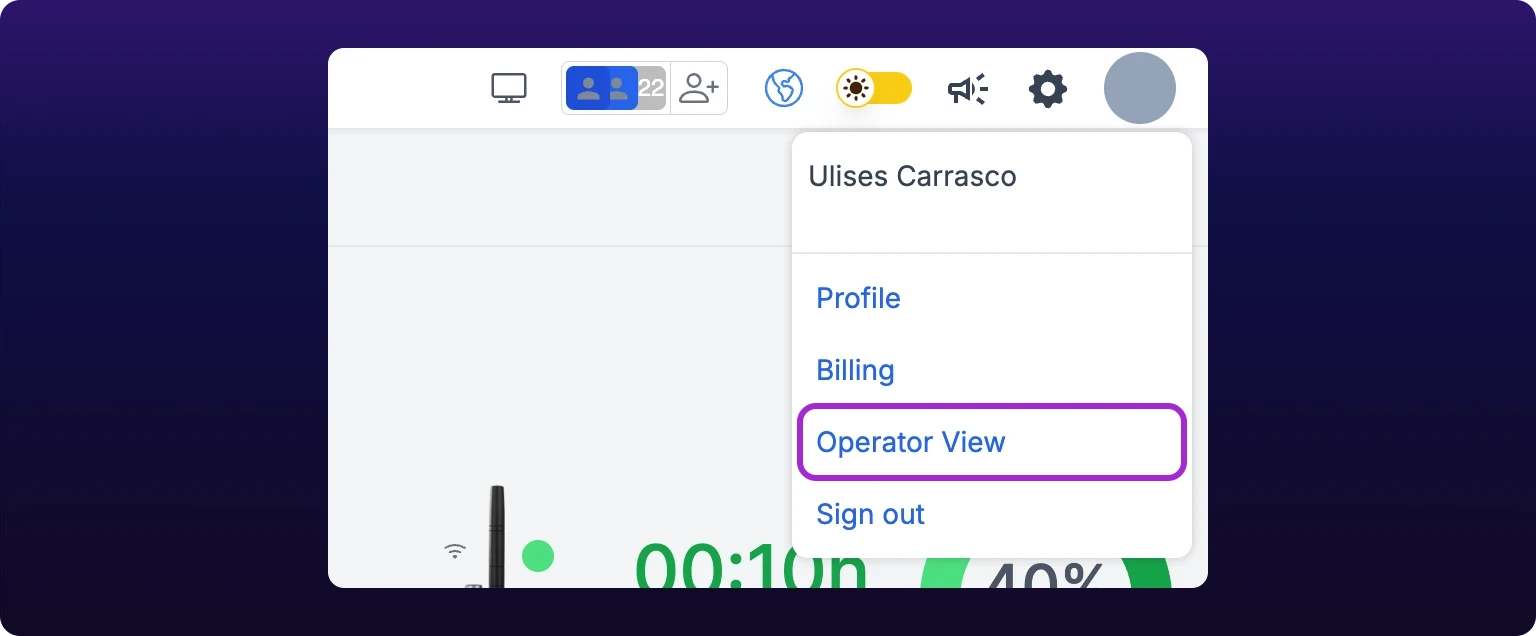 Turning on Operator View from the profile menu.
The KPI tab strip
Above the strip sit the machine's photo, name and identifier, the live status pill, the Uptime gauge against the machine's goal, and the shift's status bar. Click a stop on the bar to classify it, see Classify from the status bar. The control bar above holds a back link to Assets, the shift selector and the notifications bell.
Each tab shows a number for the selected shift. Click the tab to open it. The page remembers which tab was open on each machine, so a refresh lands where the operator left off.
| Tab | Shows | Operator can | Page | |
|---|---|---|---|---|
| 1 | Part Count | Parts made this shift, from the sensor | Correct a count, edit a work session | Production metrics |
| 2 | All Downtime | Downtime this shift as hours and minutes, red when above zero | Classify, split, unclassify or delete stops, singly or in bulk | Classify a downtime event |
| 3 | Jobs | Open jobs on this machine, active and queued | Start, pause, resume and complete a job, log parts and scrap | Run a job |
| 4 | Notes | Notes on this machine, all time | Add, edit and delete a note | Notes |
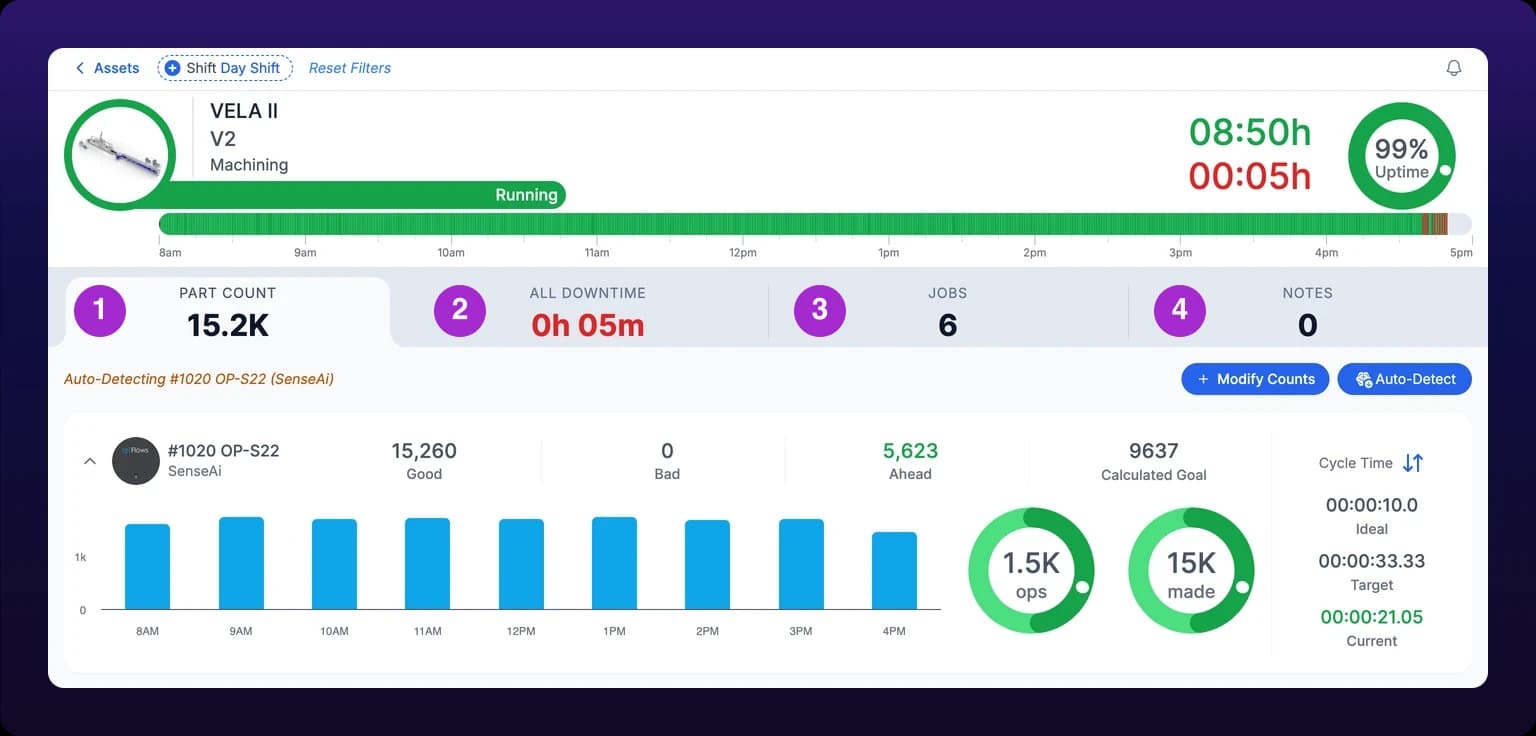 The operator page. The tab strip is the whole interface: Part Count, All Downtime, Jobs, Notes.
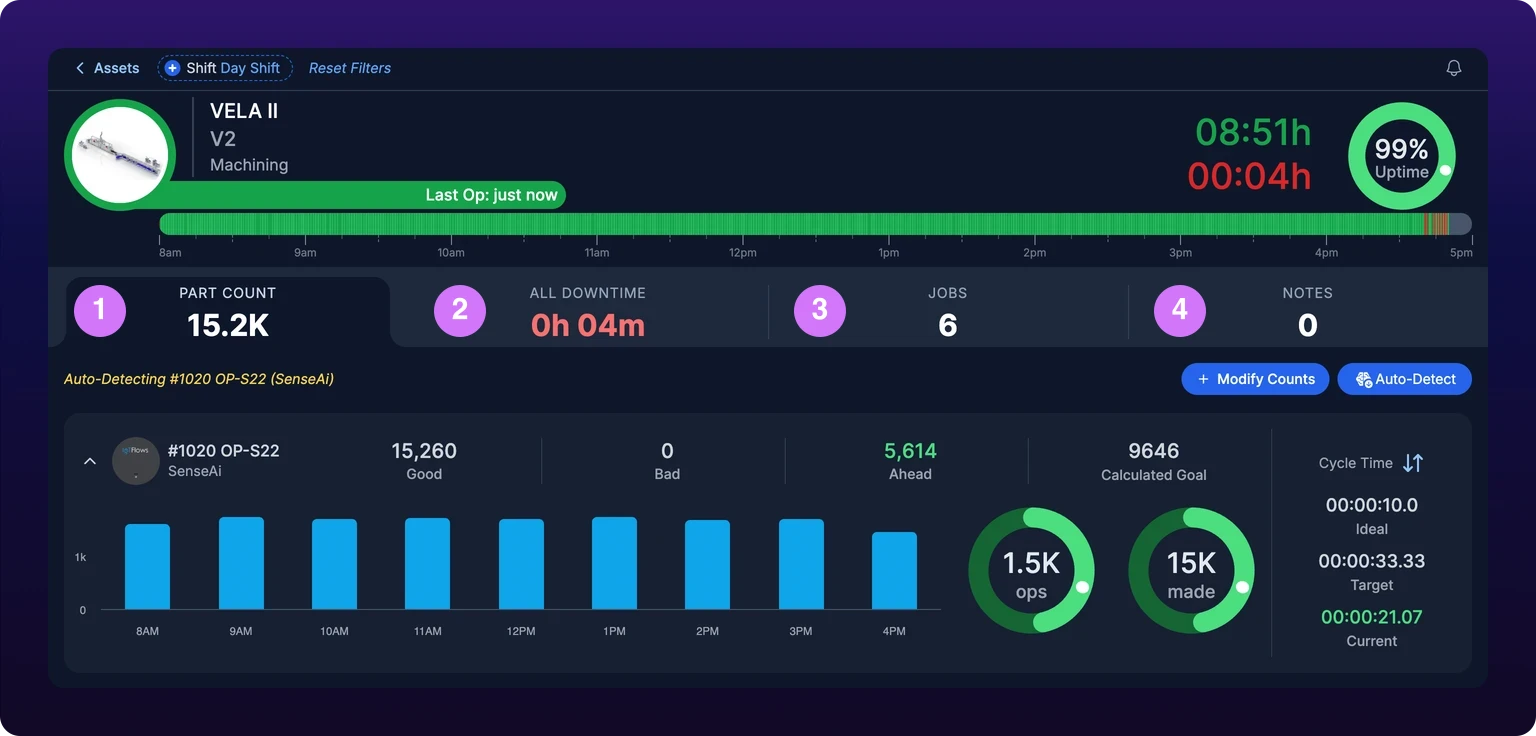
Part Count
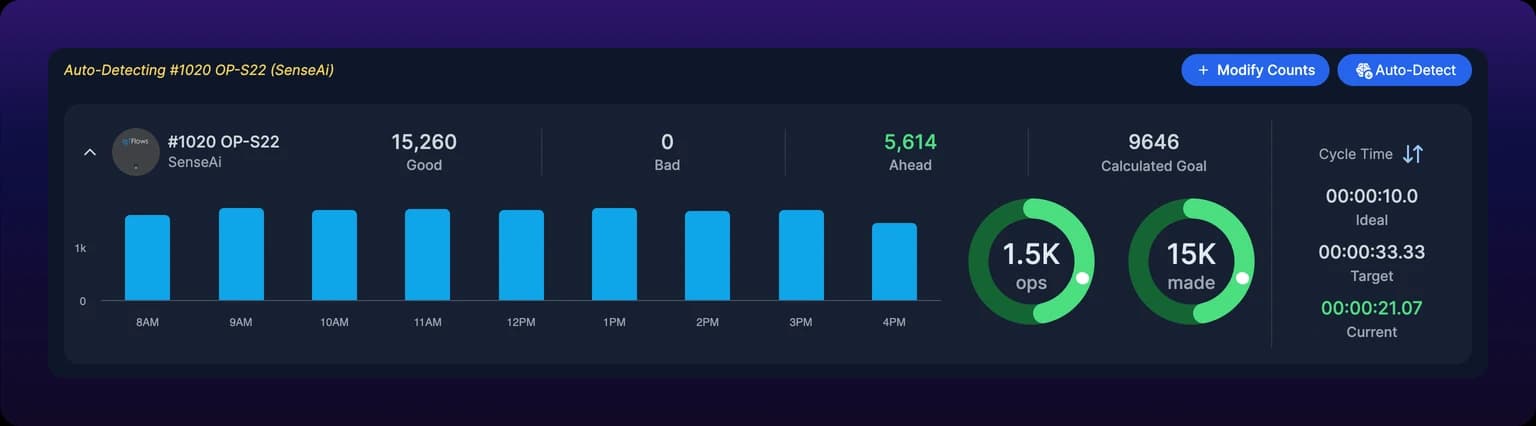
The Part Count tab is the Operation(s) Production card from the standard page at operator scale. An Auto-Detecting label names the operation the sensor is counting against. Below it, a timeline shows the shift's work sessions, and one row per operation shows the count against its goal, with the shortfall in red as Behind or the surplus in green.
The goal is the operation's hourly goal scaled to the shift, for example 240 over an eight-hour shift at 30 an hour. It is set on the operation, not here, see Set OEE and utilization goals.
Use Modify Counts when the sensor missed parts, for example after a bar feeder ran dry unnoticed. It records a manual session against an operation, see Production counts and backfilling. You do not need this if the count is right.
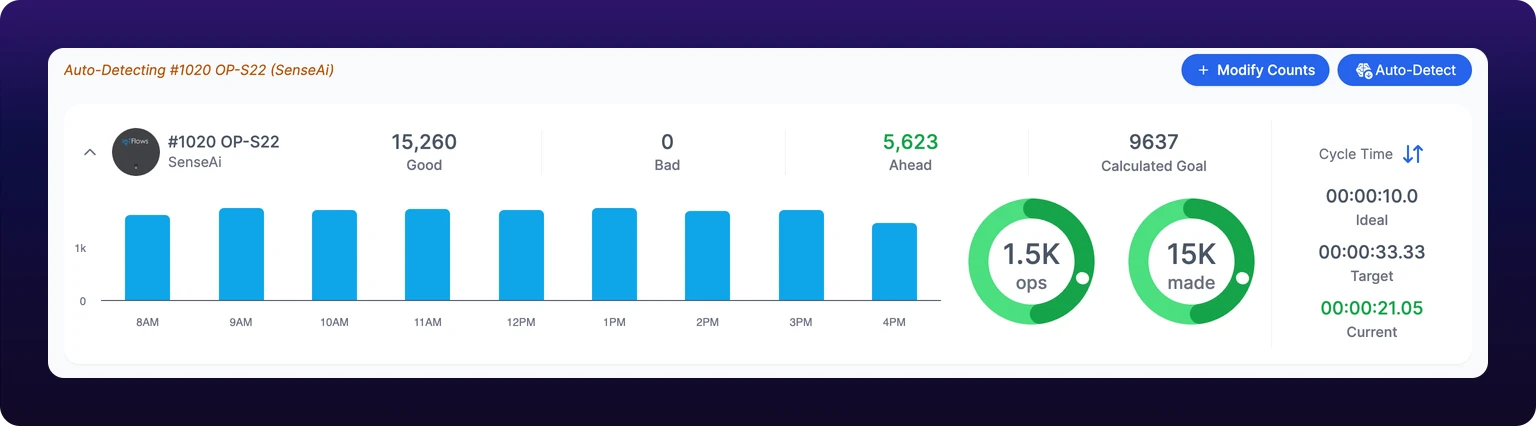 Part Count against the shift goal, as the operator sees it.
All Downtime and bulk classify
The All Downtime tab lists the shift's activities as cards, with a green bar for uptime and a red bar for a stop. It opens on the Unclassified filter, which is the backlog. The other filters are All, Uptime and Classified, each with its count.
Each stop carries Classify, Split and Delete. A classified stop shows its category and severity chip, and swaps Classify for Edit and Remove. An uptime card carries Edit, which changes the operation the run counted against.
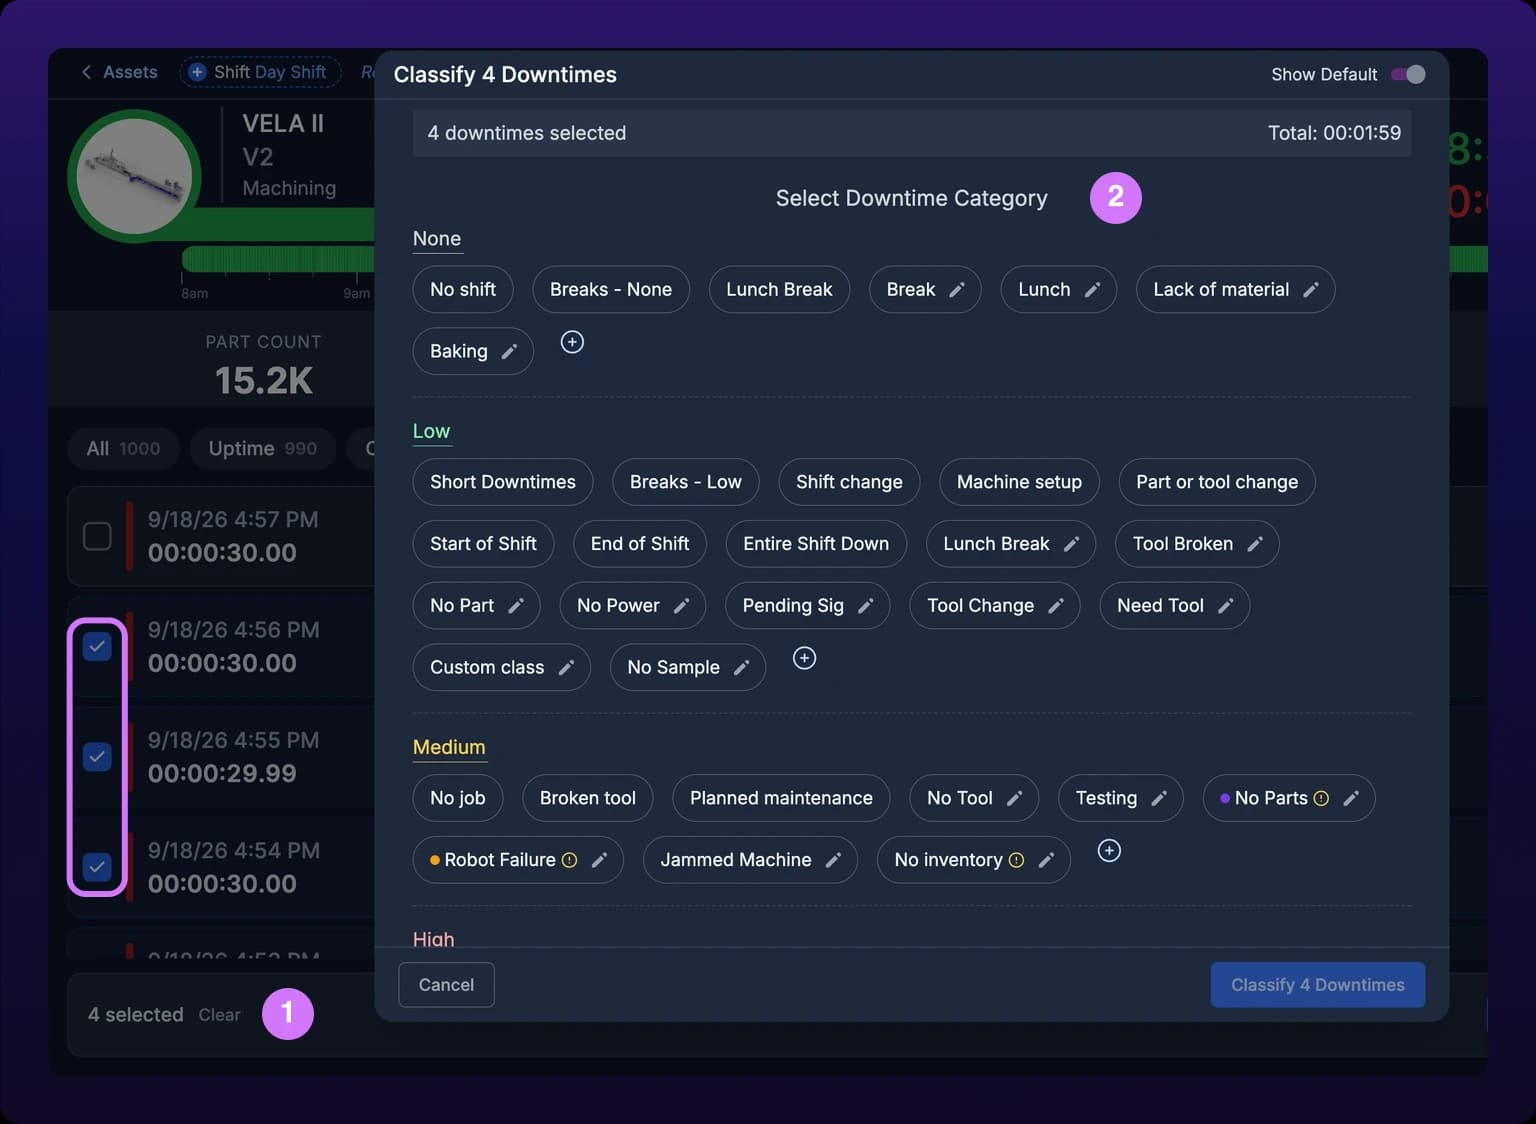
Bulk classification is the reason this tab exists. Click stops to select them, or click Select all N unclassified, then click Classify N Downtimes in the bar at the bottom. The steps, and when not to use it, are in Bulk classify.
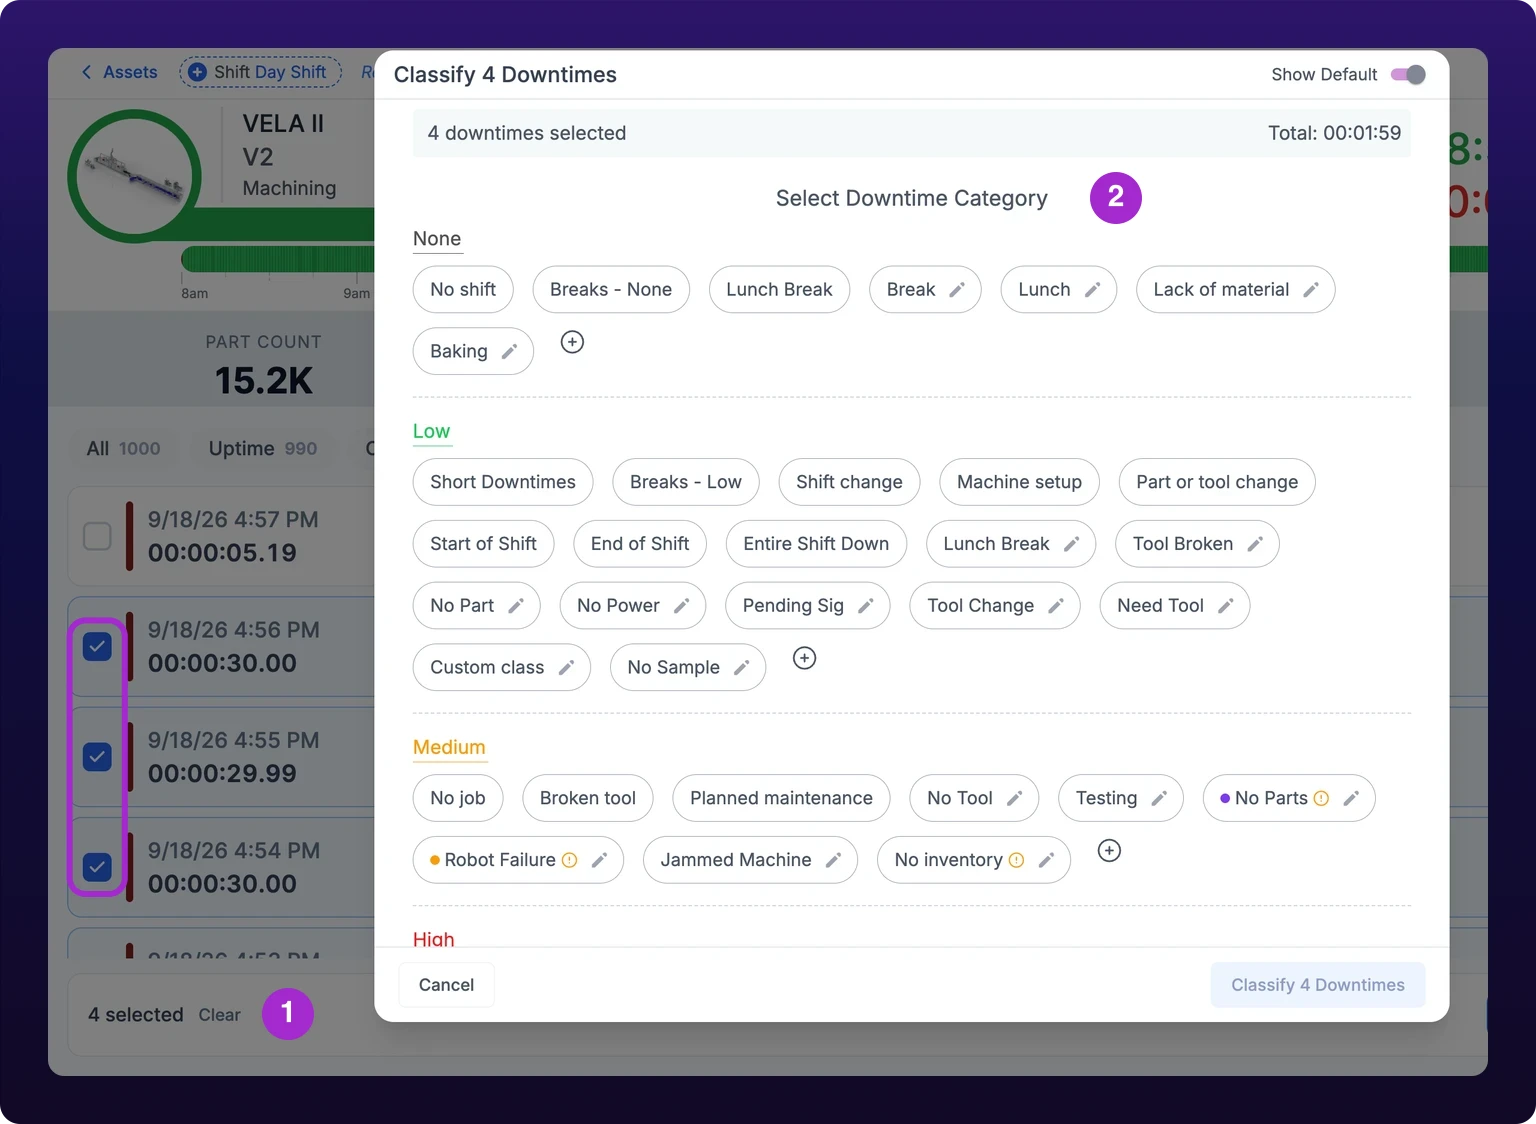 Bulk classifying several stops with the same reason.
Jobs
The Jobs tab lists the machine's production jobs behind an Active, Done and All toggle, with a + to create one and the shift timeline above the list. The number on the tab counts active and queued jobs, not closed ones.
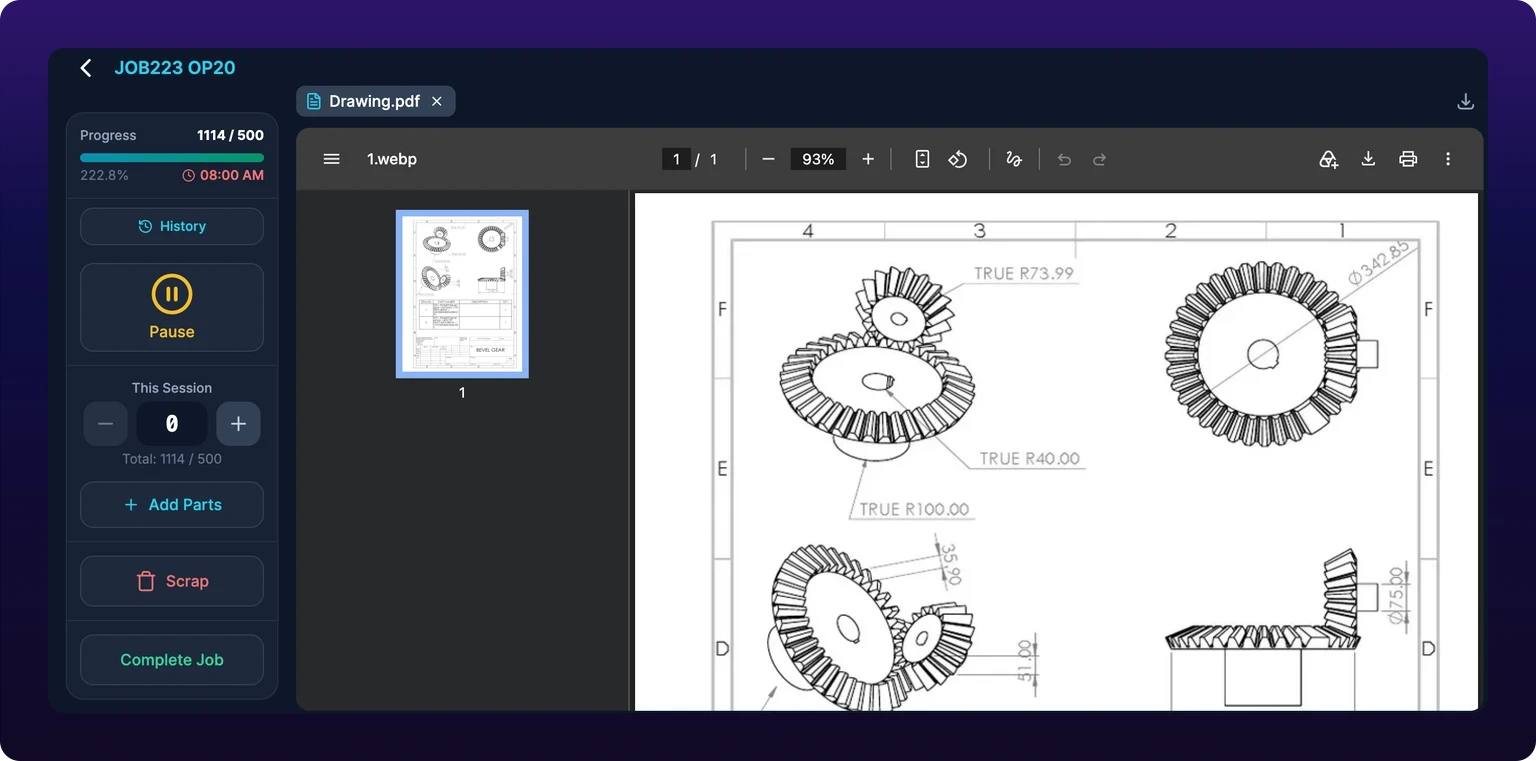
Click a job to open it. The detail view has the same controls as the Work Queue: Start, which becomes Pause and then Resume; a − and + counter with Add Parts for a larger number; Scrap; and Complete Job. Every change goes to the same job session the Work Queue reads, so a supervisor sees it at once.
The procedure lives in Run a job and Log scrap.
A job opened from Done or All can be reopened, which returns it to in progress.
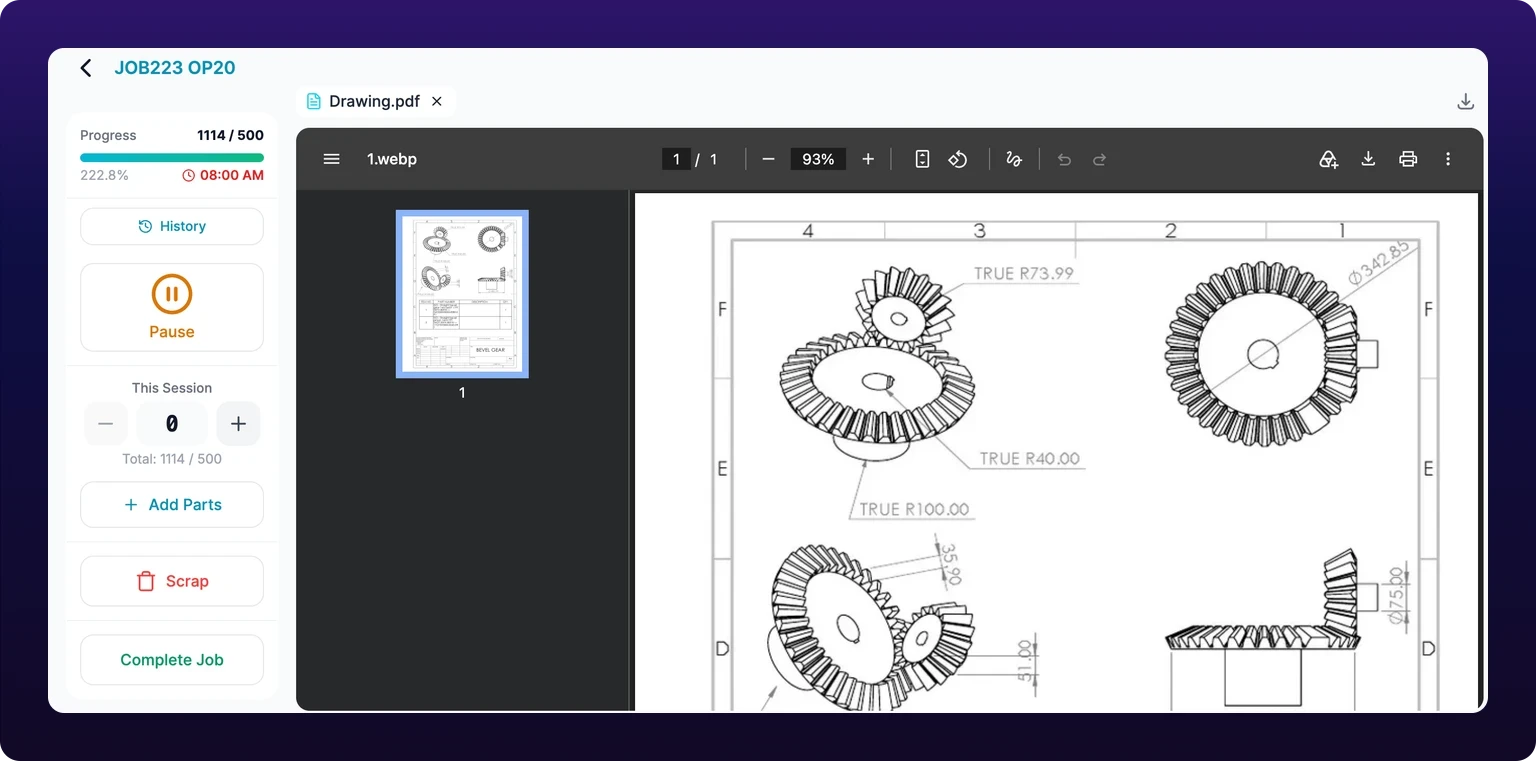 The Jobs tab runs the job without leaving the machine's page.
Notes
The Notes tab is the machine's note list, newest first, with Add Note at the top. Each note shows its author and time, and can be edited or deleted in place. It is the same list as Notes on the standard page's Health tab, so a note about chatter at 2 pm is what the maintenance planner reads next morning, see Notes.
Leaving Operator View
The Assets link at the top left returns to the fleet page. Operator View stays on, so the next machine opened renders the same way.
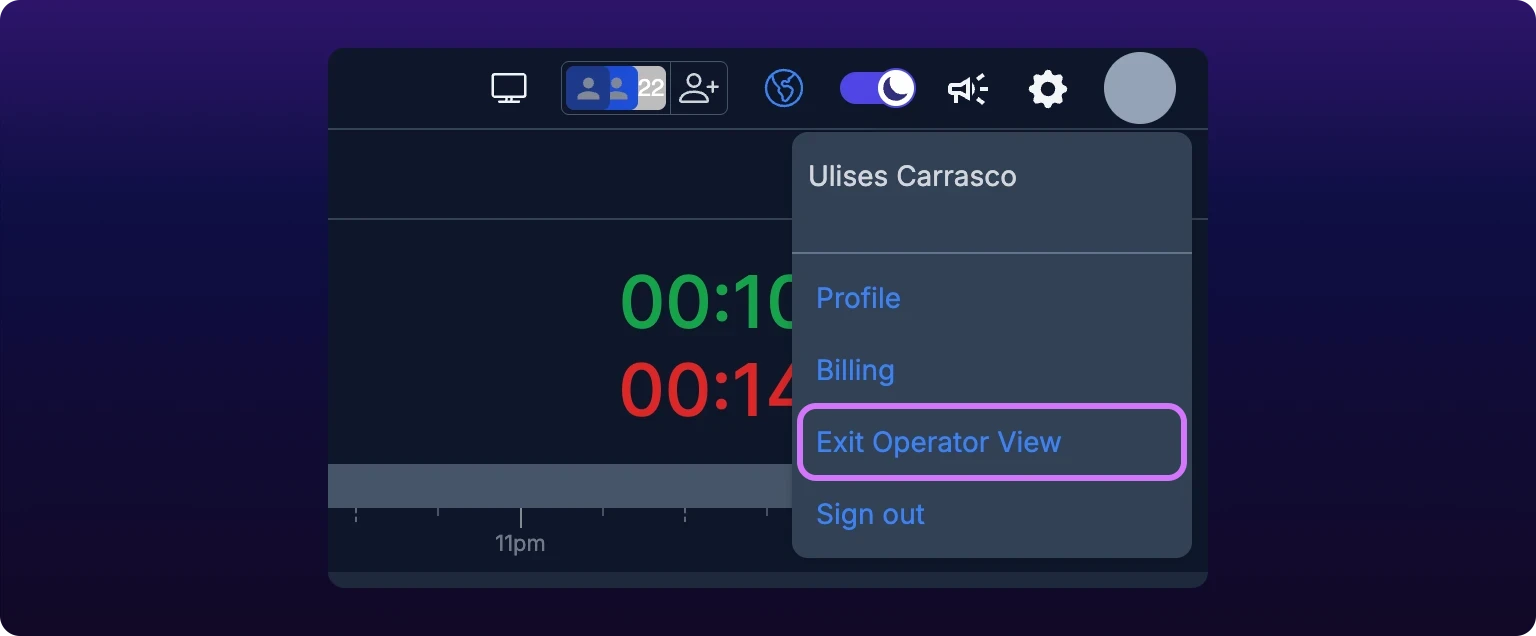
To turn it off, click your avatar and click Exit Operator View. The page reloads as the standard machine page. Any signed-in user can do this: Operator View is a display preference, not a lock.
A device that must stay on its machine whoever is signed in is an operator station, whose exit is gated to an Owner or Administrator, see Set up a dedicated operator station and Roles reference.
 Turning Operator View off from the same menu. Any signed-in user can do this.
Errors
| Message | Means |
|---|---|
| No active session — start the job first | You logged parts or scrap on a job that is not running. Click Start on the job, then log again |
| Failed to log part, Failed to record scrap | The session was not updated; the counter shows the last saved value. Retry |
| Failed to update job status | The status change was not saved; the job returns to its previous state. Retry |
| Failed to classify | None of the selected stops were classified; the selection is kept. Retry |
| This category requires an additional note | The category you picked needs a note before Classify is enabled, see Downtime categories |
See also
From the blog
Put a live fleet view on a shop-floor screen: expand the Assets page to full screen, install the IoTFlows app on a Chromecast with Google TV, pair it with the code it displays, send it any dashboard URL from the Send URL Link modal, set its zoom, and rename or delete screens. Paired screens reload their URL on boot.
Pair a shared tablet or PC to one machine from Assigned Asset in Organization Settings so it boots straight to /assets/operator-asset/:id after every sign-in, with a header that has no product navigation. The pairing lives in that browser's local storage, so it holds whoever signs in; each sign-in clocks the operator in on the machine. Leaving needs an Owner or Administrator, and unassigning is the same setting in reverse.