

Set OEE and utilization goals
Set the percentage that every uptime and production gauge in IoTFlows is colored against.
An OEE goal is a single target percentage. At or above it a gauge draws green, below it the gauge draws red. Your organization has one goal, and every machine inherits it until you give that machine a goal of its own.
The metric being judged is uptime, availability: running time over running plus stopped time. See Uptime.
Before you start
- Sign in as an Organization Owner or Organization Administrator. See Roles reference.
- Have machines reporting for at least a few weeks. A goal set before you have a baseline is a guess. See Add a machine.
Set the organization goal
The organization goal is the default every machine inherits, and it is the only goal the fleet Utilization tile uses.
- Open the Assets page at
/assets. - In the row of tiles across the top of the page, select the target icon in the top right corner of the Utilization tile, tooltipped Adjust OEE Goal. Selecting the percentage itself opens the same dialog.
- In Set OEE Goal, type your target under Set Organization Utilization / OEE Goal. Enter a whole percentage, for example
62, not0.62. - Select Set.
IoTFlows confirms with "Organization OEE Goal Updated" and recolors the page. The goal belongs to the organization, so every member sees the new number on their next load.
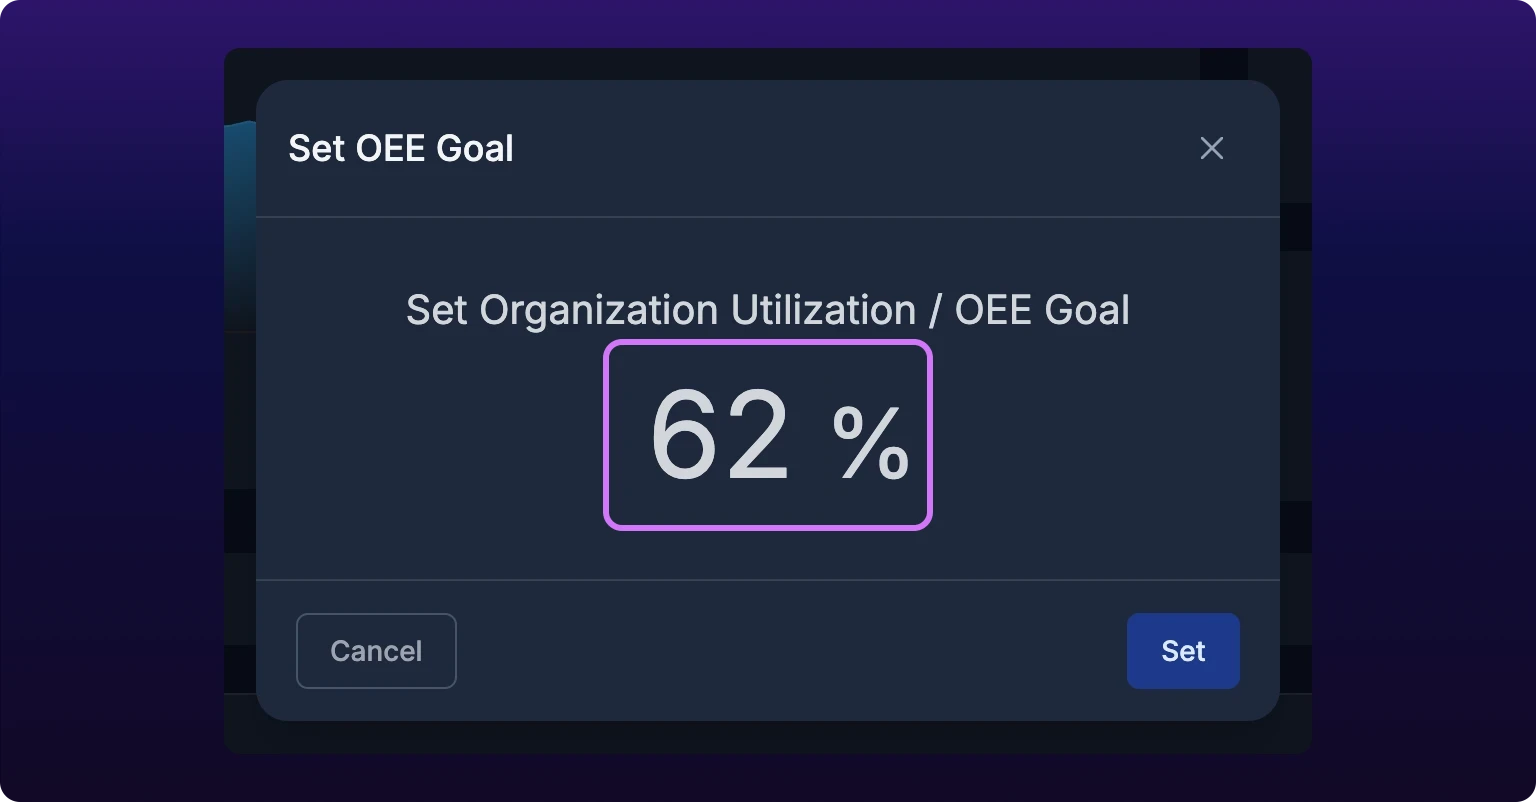
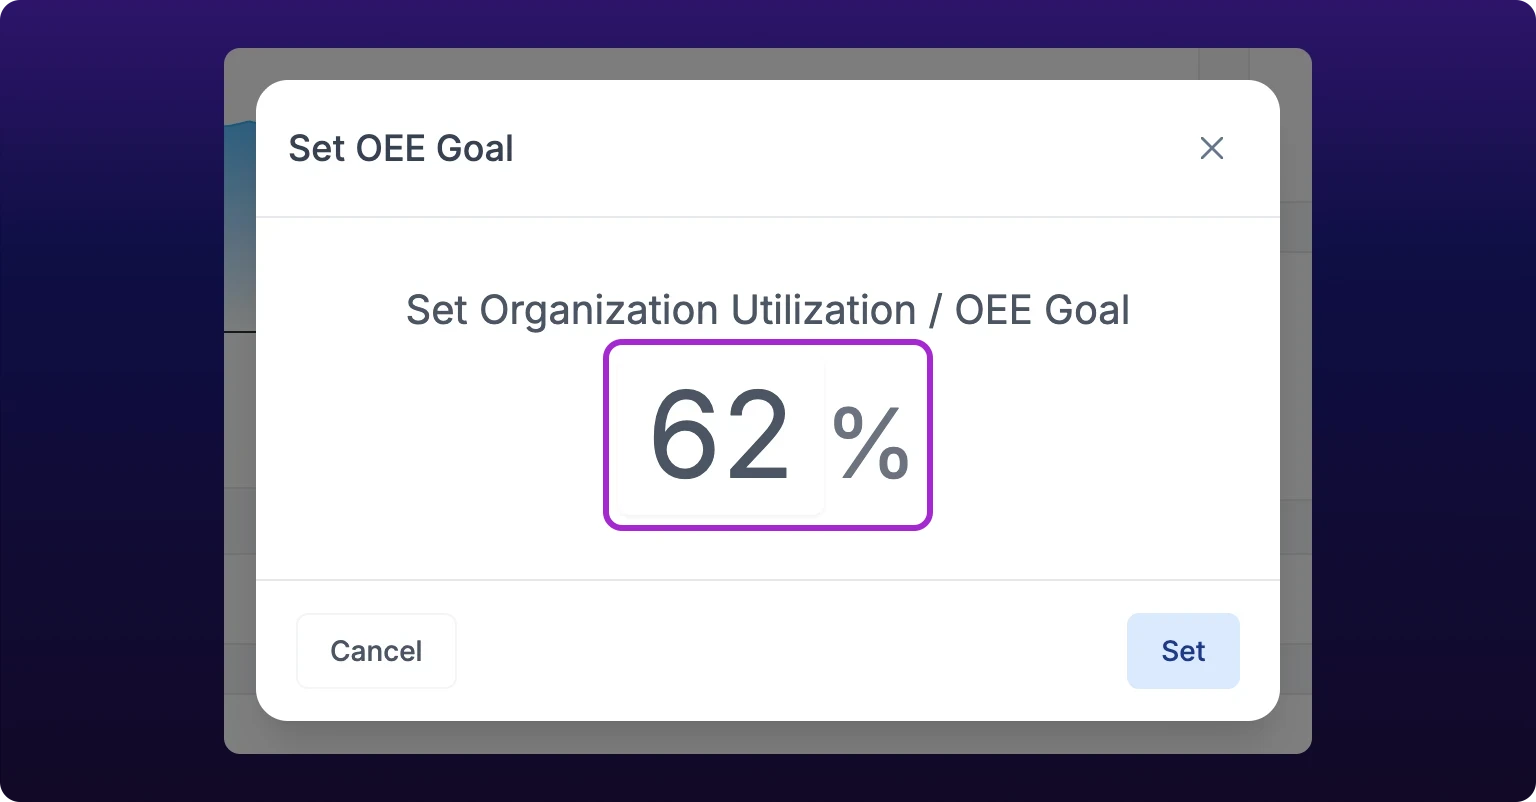 The Set OEE Goal dialog, reached from the Utilization tile on the Assets page. Set the organization number from your own baseline, not from an industry figure.
Set a goal for one machine
You do not need a per-machine goal for every asset. Set one only where a machine's realistic ceiling genuinely differs from the plant's:
- A machine that runs two hours a day by design, such as a sample press or a deburring cell.
- A machine whose work is set-up heavy, where cutting time is a small share of the shift.
- A machine that waits on an upstream cell and can never run more than that cell allows.
Everywhere else, leave the organization goal in place. A fleet where every machine carries its own goal stops being comparable, because a green gauge no longer means the same thing on two cards.
- Open the machine at
/assets/selected-asset/:id. See Inspect a single machine. - Select the Uptime gauge in the header. On a phone the gauge carries the hint "Tap to set Uptime goal".
- Turn on Set Custom Utilization / OEE Goal. Custom Goal for Machine on the right becomes editable and Default Organization Goal on the left dims.
- Type the percentage for this machine.
- Select Set.
IoTFlows confirms with "Asset OEE Goal Updated". This machine's gauges recolor immediately and no other machine changes.
To put the machine back on the plant's number, open the same dialog, turn Set Custom Utilization / OEE Goal off, and select Set. The custom goal is cleared rather than remembered, so switching back later means typing it again.
Why is the left-hand field editable? Default Organization Goal is the organization's number, shown beside the custom one so you can see what this machine is departing from. Set the organization goal from the Utilization tile on the Assets page instead, where the dialog names what you are changing and the fleet figure is on screen next to it.
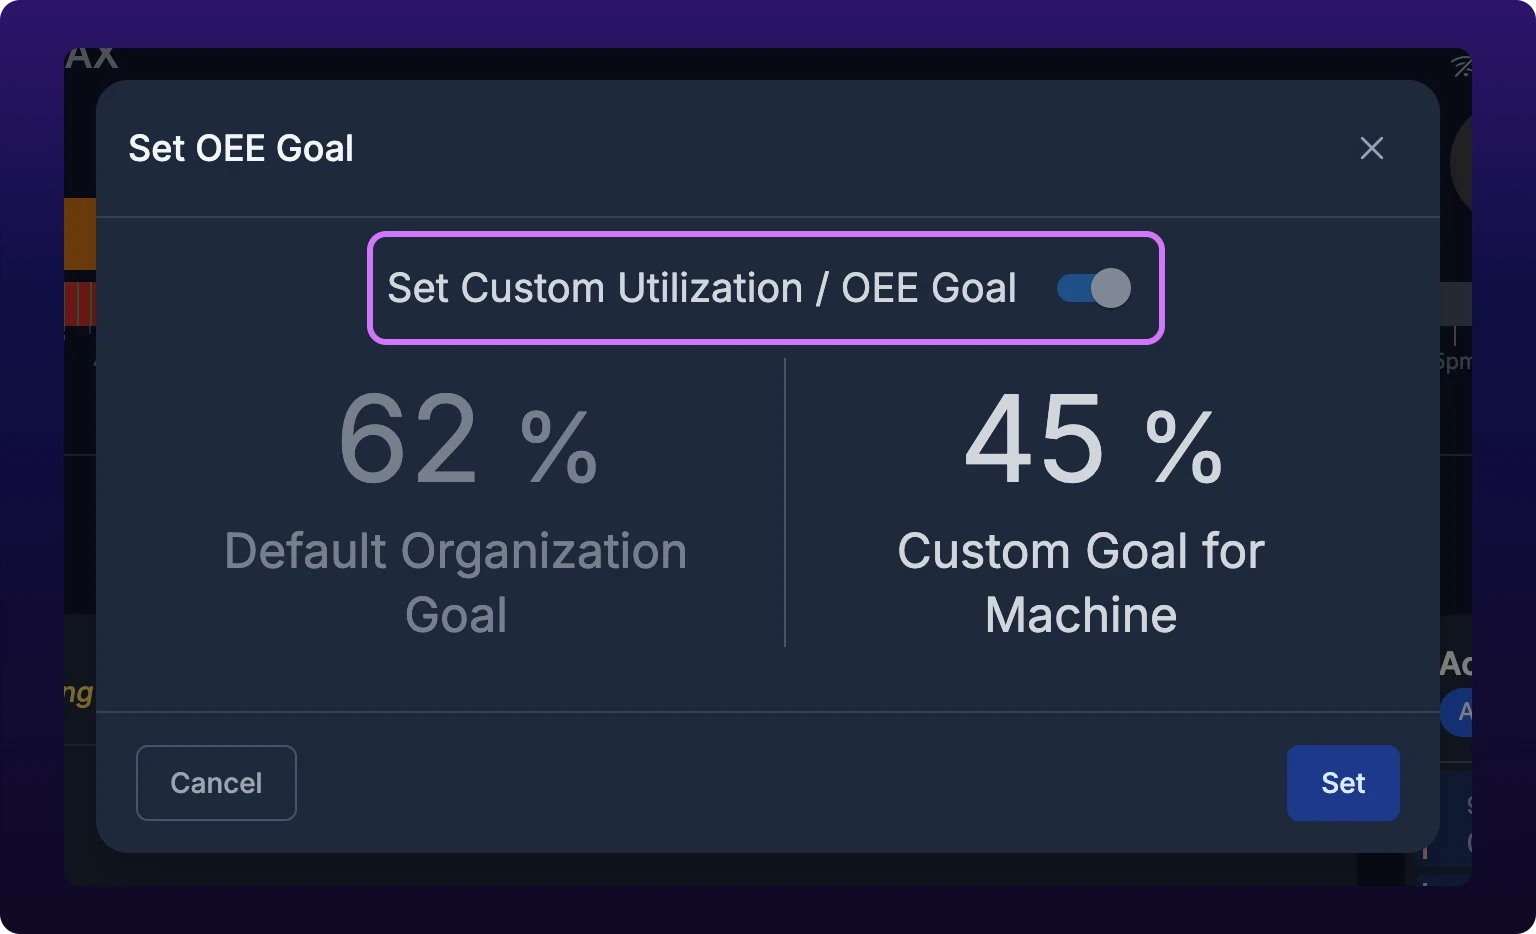
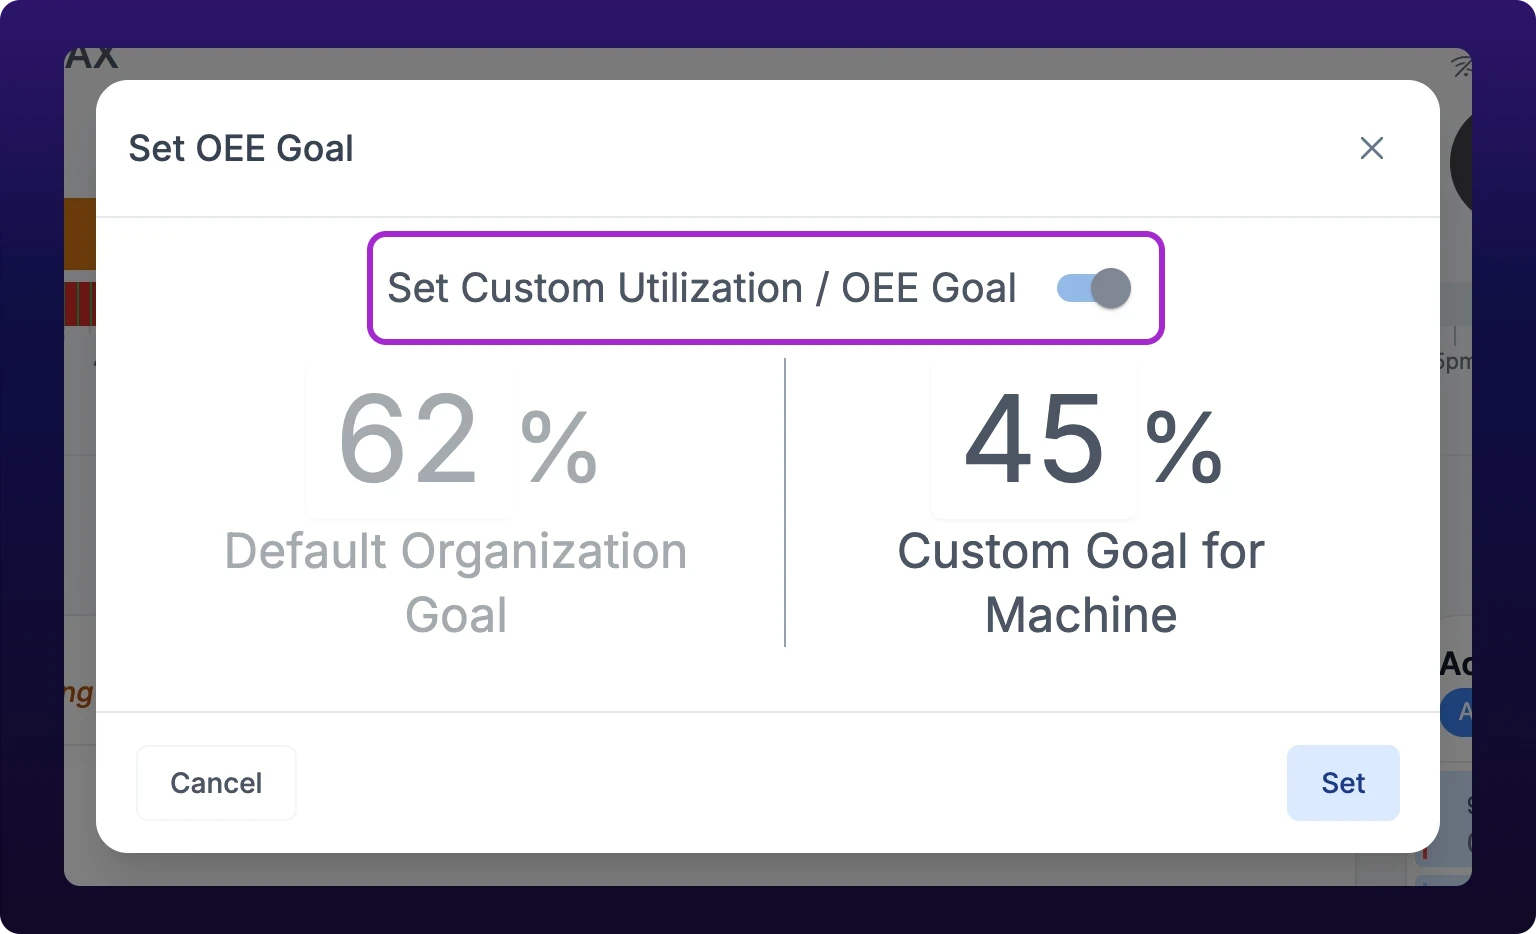 The same dialog opened from a machine's Uptime gauge, with Set Custom Utilization / OEE Goal turned on: the organization's 62% on the left, this machine's 45% on the right.
Where the goal appears
Every surface below colors a percentage against a goal. Only one of them uses the organization's.
| Surface | Uses organization goal | Uses machine goal |
|---|---|---|
| Utilization tile at the top of the Assets page | Yes | No |
| Uptime gauge on a machine card, in every card view | No | Yes |
| Utilization column in list view | No | Yes |
| Parts and cycle-time gauges on a machine card | No | Yes |
| Uptime gauge in a machine page header | No | Yes |
| Header gauge in Operator View | No | Yes |
| Progress and cycle gauges on Shift Production | No | Yes |
| Machine cards and rows on a phone | No | Yes |
"Machine goal" means the machine's own goal where you have set one, and the organization goal everywhere else. In a plant that has never set a per-machine goal, every row in that table resolves to the same number.
The coloring is binary. At or above the goal a gauge is green; below it, red. There is no orange.
Orange on the Assets page is a downtime threshold, a duration rather than a percentage, and it is unrelated to the goal. See Set status colors and downtime thresholds.
The goal also colors production, not just uptime. The parts gauge compares parts made against what the ideal cycle time implies for the period you are viewing, then colors that percentage against the same OEE goal. Raising the organization goal from 60% to 80% turns some parts gauges red without anything changing on the floor.
The ideal cycle time behind that comparison is set per operation. See Set cycle times and downtime filters.
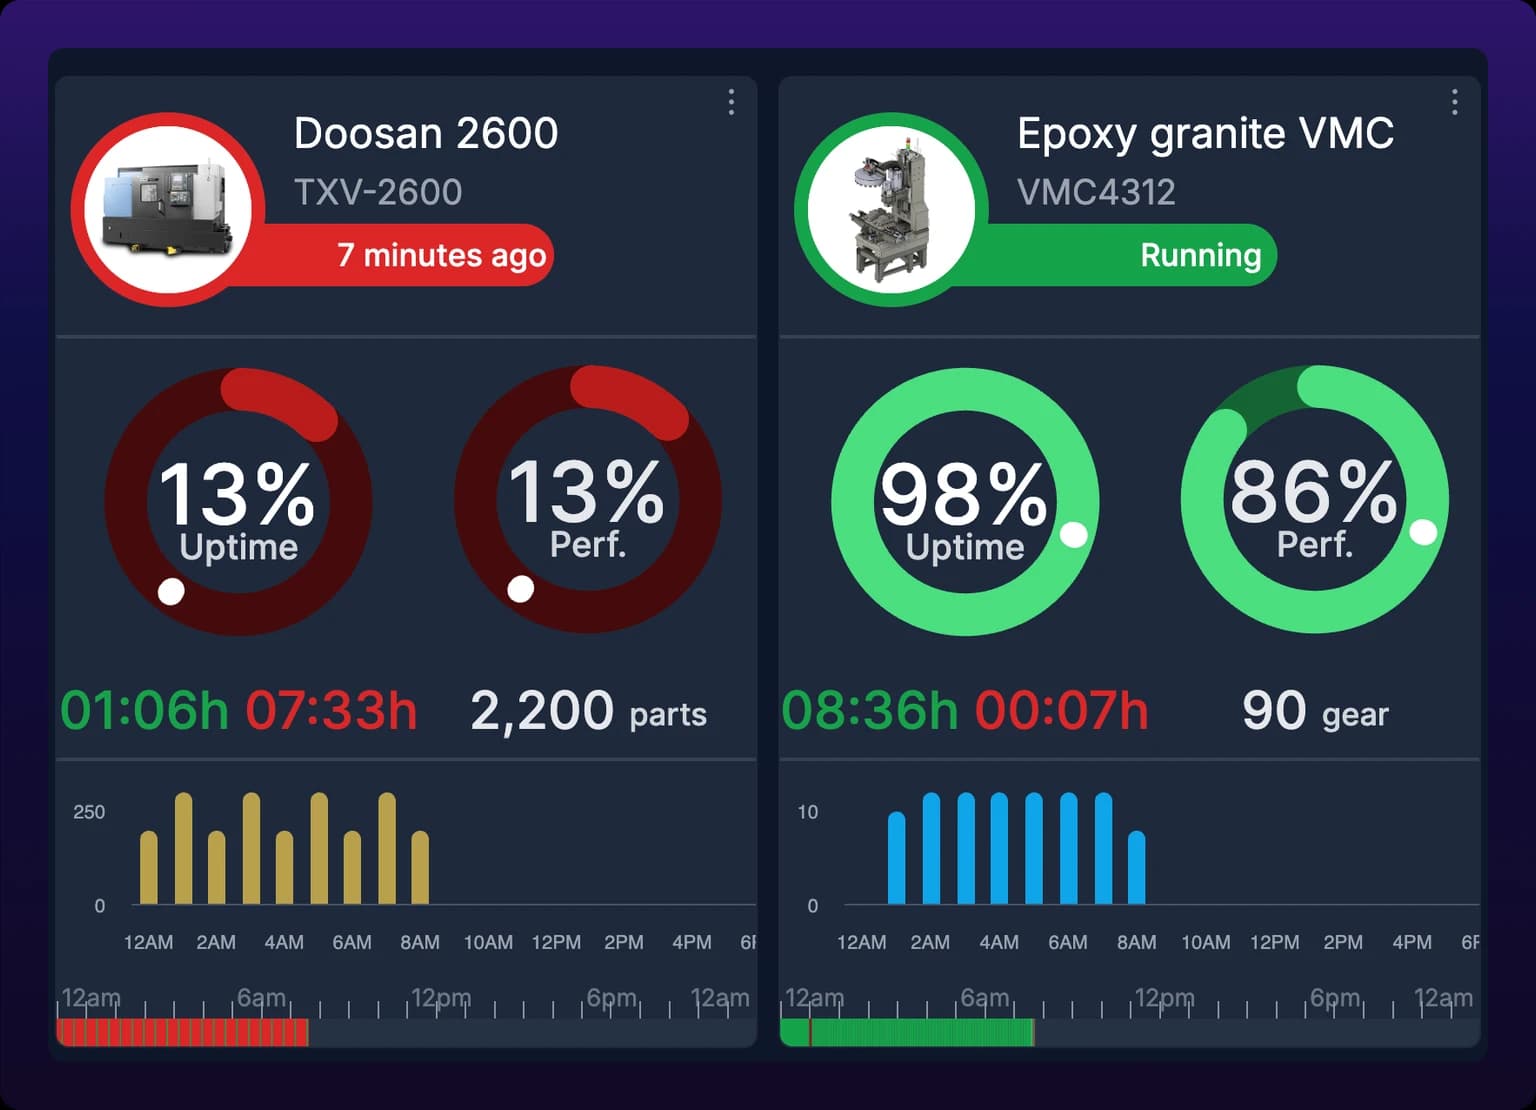
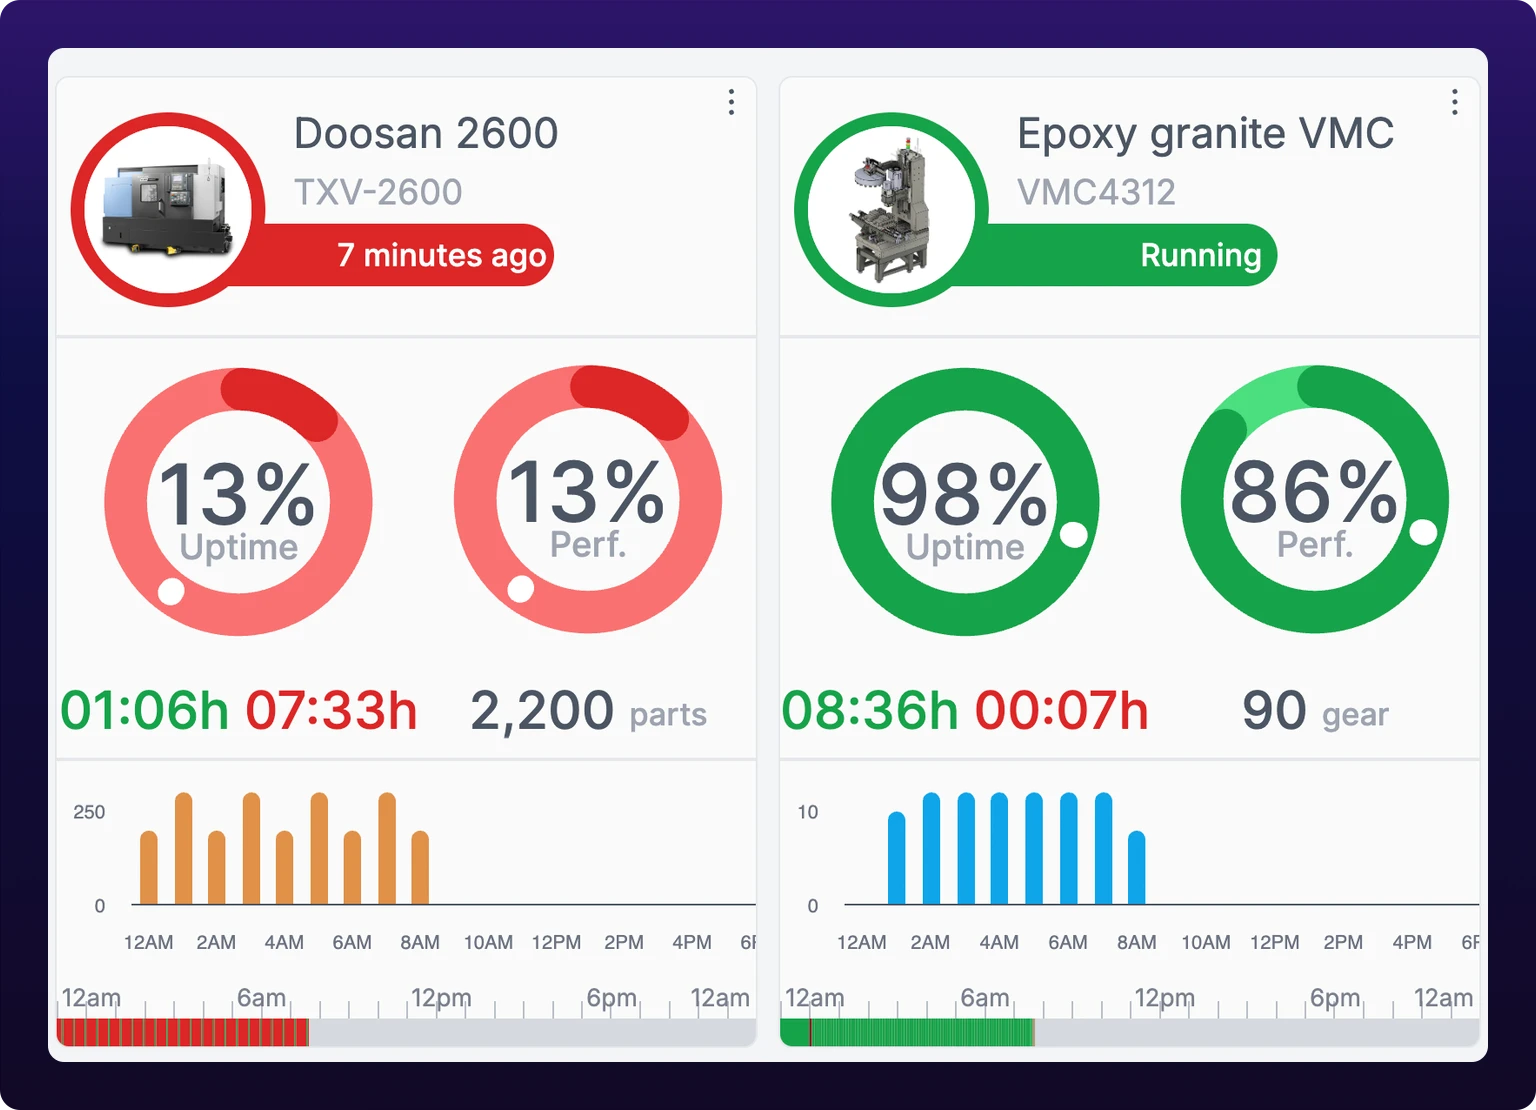 Two machine cards side by side: the Uptime gauge is green on the machine at or above its goal and red on the machine below it.
The goal and the window you are viewing
A window is the period selected at the top of the page: a shift, a day, or a custom range. Every surface in the table reports the window you have selected. The goal itself is one percentage and does not move with it; what moves is the figure it is compared against.
That figure is computed across the whole window, not averaged per shift. A machine that ran 90% on first shift and 30% on second, both shifts the same length, reads 60% for the day. It does not report that one shift met the goal and one missed it.
A custom range covering three shifts totals running and stopped time across all three and divides once. So a goal that looks like it is being applied to the wrong period is a window problem, not a goal problem. Check the shift and date selectors before you change the number, see Choose the window.
Choose a number
Set the first goal from your own baseline, not from an industry number. A plant reading 48% that sets a goal of 85% has told every operator the board is fiction, and a board nobody believes is a board nobody reads.
- Open the Advanced Report over the last complete quarter. See Build a utilization report.
- Read the organization's utilization for that period. That figure is your baseline.
- Set the goal a few points above it. A plant at 48% sets 55%, not 85%.
- Leave it alone for a quarter, then move it when the plant moves.
Per-machine goals follow the same rule against that machine's own history rather than the plant's. The Advanced Report breaks the period down by machine, so read that machine's row and set its goal from there.
When a change does not save
A failed save shows the message the server returned, or the generic "Something went wrong" toast, and the dialog stays open with your number still in it. Nothing was written.
Reopen the dialog and read the goal back before assuming the change took. See Troubleshoot wrong utilization or OEE.
See also
From the blog
- What is machine utilization, and how do you calculate it?Machine utilization is running time divided by the time a machine could have run. Learn the four denominators, work one week by hand and pick the right one.
- What utilization to expect by machine typeA manual CNC runs 40–60% of the shift, a coil-fed press 65–80% and a lights-out cell 80–90%. See why loading sets the ceiling and how to set each goal.
- Manual vs automatic OEE tracking in the first weekMachine-reported stops move lost minutes from performance into availability. OEE itself moves only if part counts, ideal cycle times or planned time were off.
A cascading group ties machines that one part passes through in sequence into a single line on the Assets page. Step 1 is the reference: every step after it reports first pass yield, parts lost and a rate difference against Step 1's count. You create and name groups from the Cascading Group field in a machine's Edit dialog, give each machine a step number, and switch the whole line onto a new part and a per-machine operation in one action. A cascade reads in full only in list view, and changes the Assets page rather than any report.
Two durations decide when a stopped machine turns orange and then red on the Assets page. Set both, and the color red itself, from Adjust Status Colors on the Utilization tile. The thresholds are organization-wide, they are cosmetic rather than analytical, and a classified stop skips them for dark red. Owner or Administrator.