

Quickstart: read your first shift of machine data
Read one shift correctly, from the KPI row down to a single stop.
This page walks the happy path through the Assets page and one machine, with no branches. Every control it skips is covered on Monitor your fleet on the Assets page.
Before you start, you need:
- A device online and sending data. If not, follow the get started quickstart.
- At least one shift defined for the organization, see Shifts and time zone. Without one, every number on this page is a whole calendar day.
Open the Assets page
- Sign in to the dashboard on the web.
- Click Assets in the top navigation. The page opens at
/assets?select=overview.
The page shows every machine you are allowed to see, live: four tiles across the top and a card for each machine below.
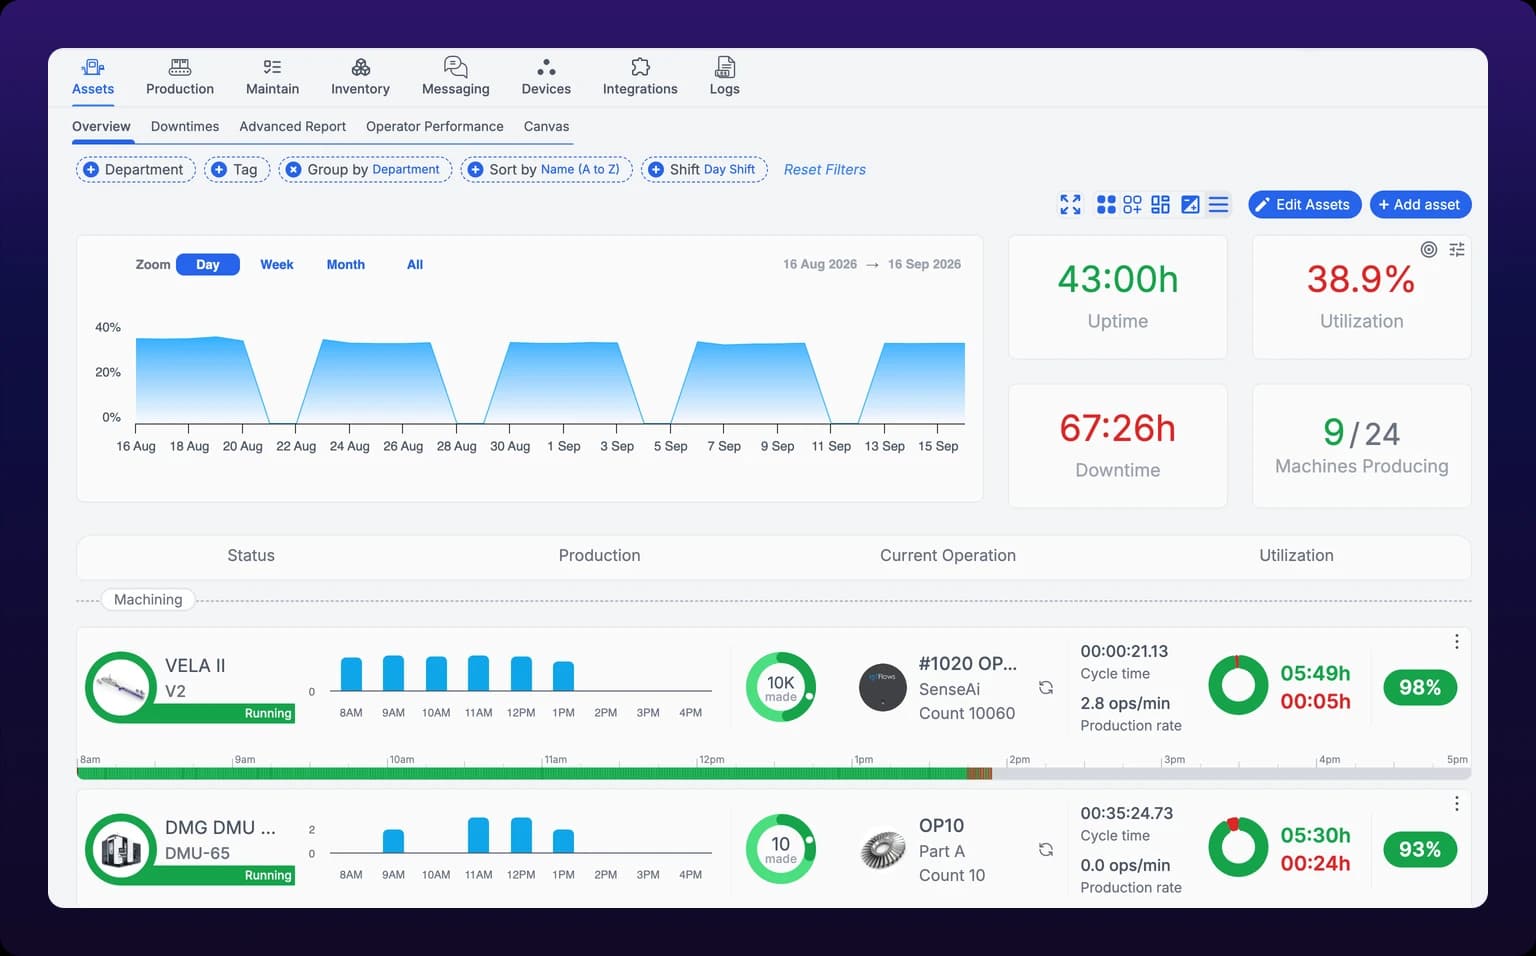 The Assets page mid-shift. Every machine in the organization, live.
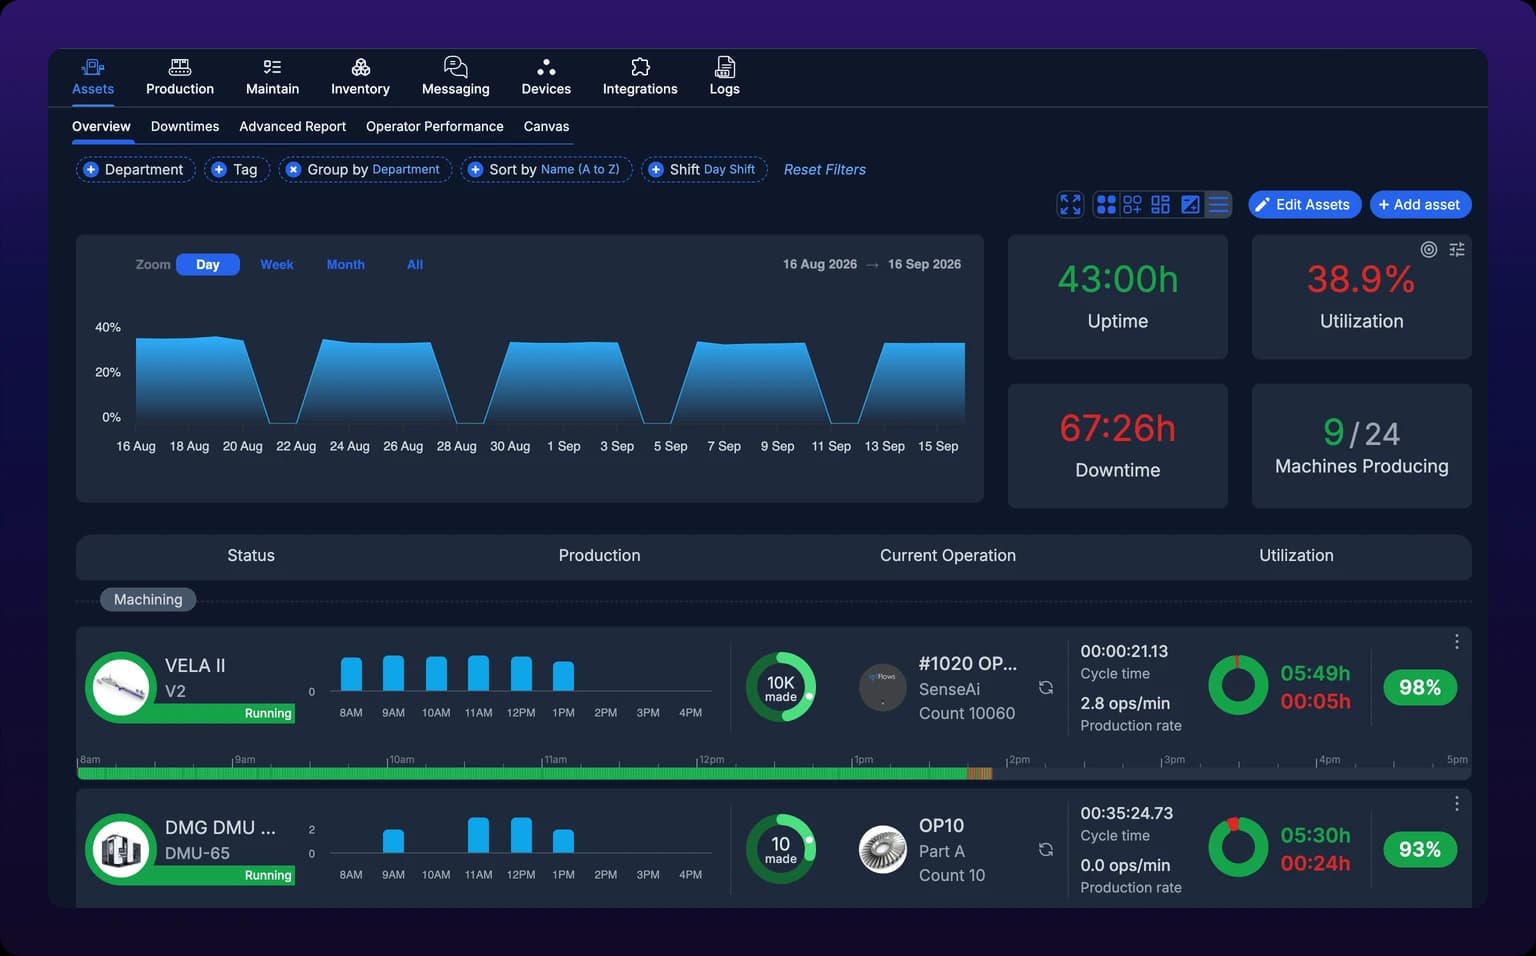
If the page is empty, no machine has been added yet. See Add a machine.
Pick the shift and date
A shift is a named window of the day, such as Day Shift from 06:00 to 14:00, defined once for the organization. Every number on the Assets page counts only the shift you have selected.
- Click the shift selector in the toolbar. It shows the current shift by default.
- Under Shift, pick the shift you want to read.
- Under Select Date, leave today selected.
- Click Apply.
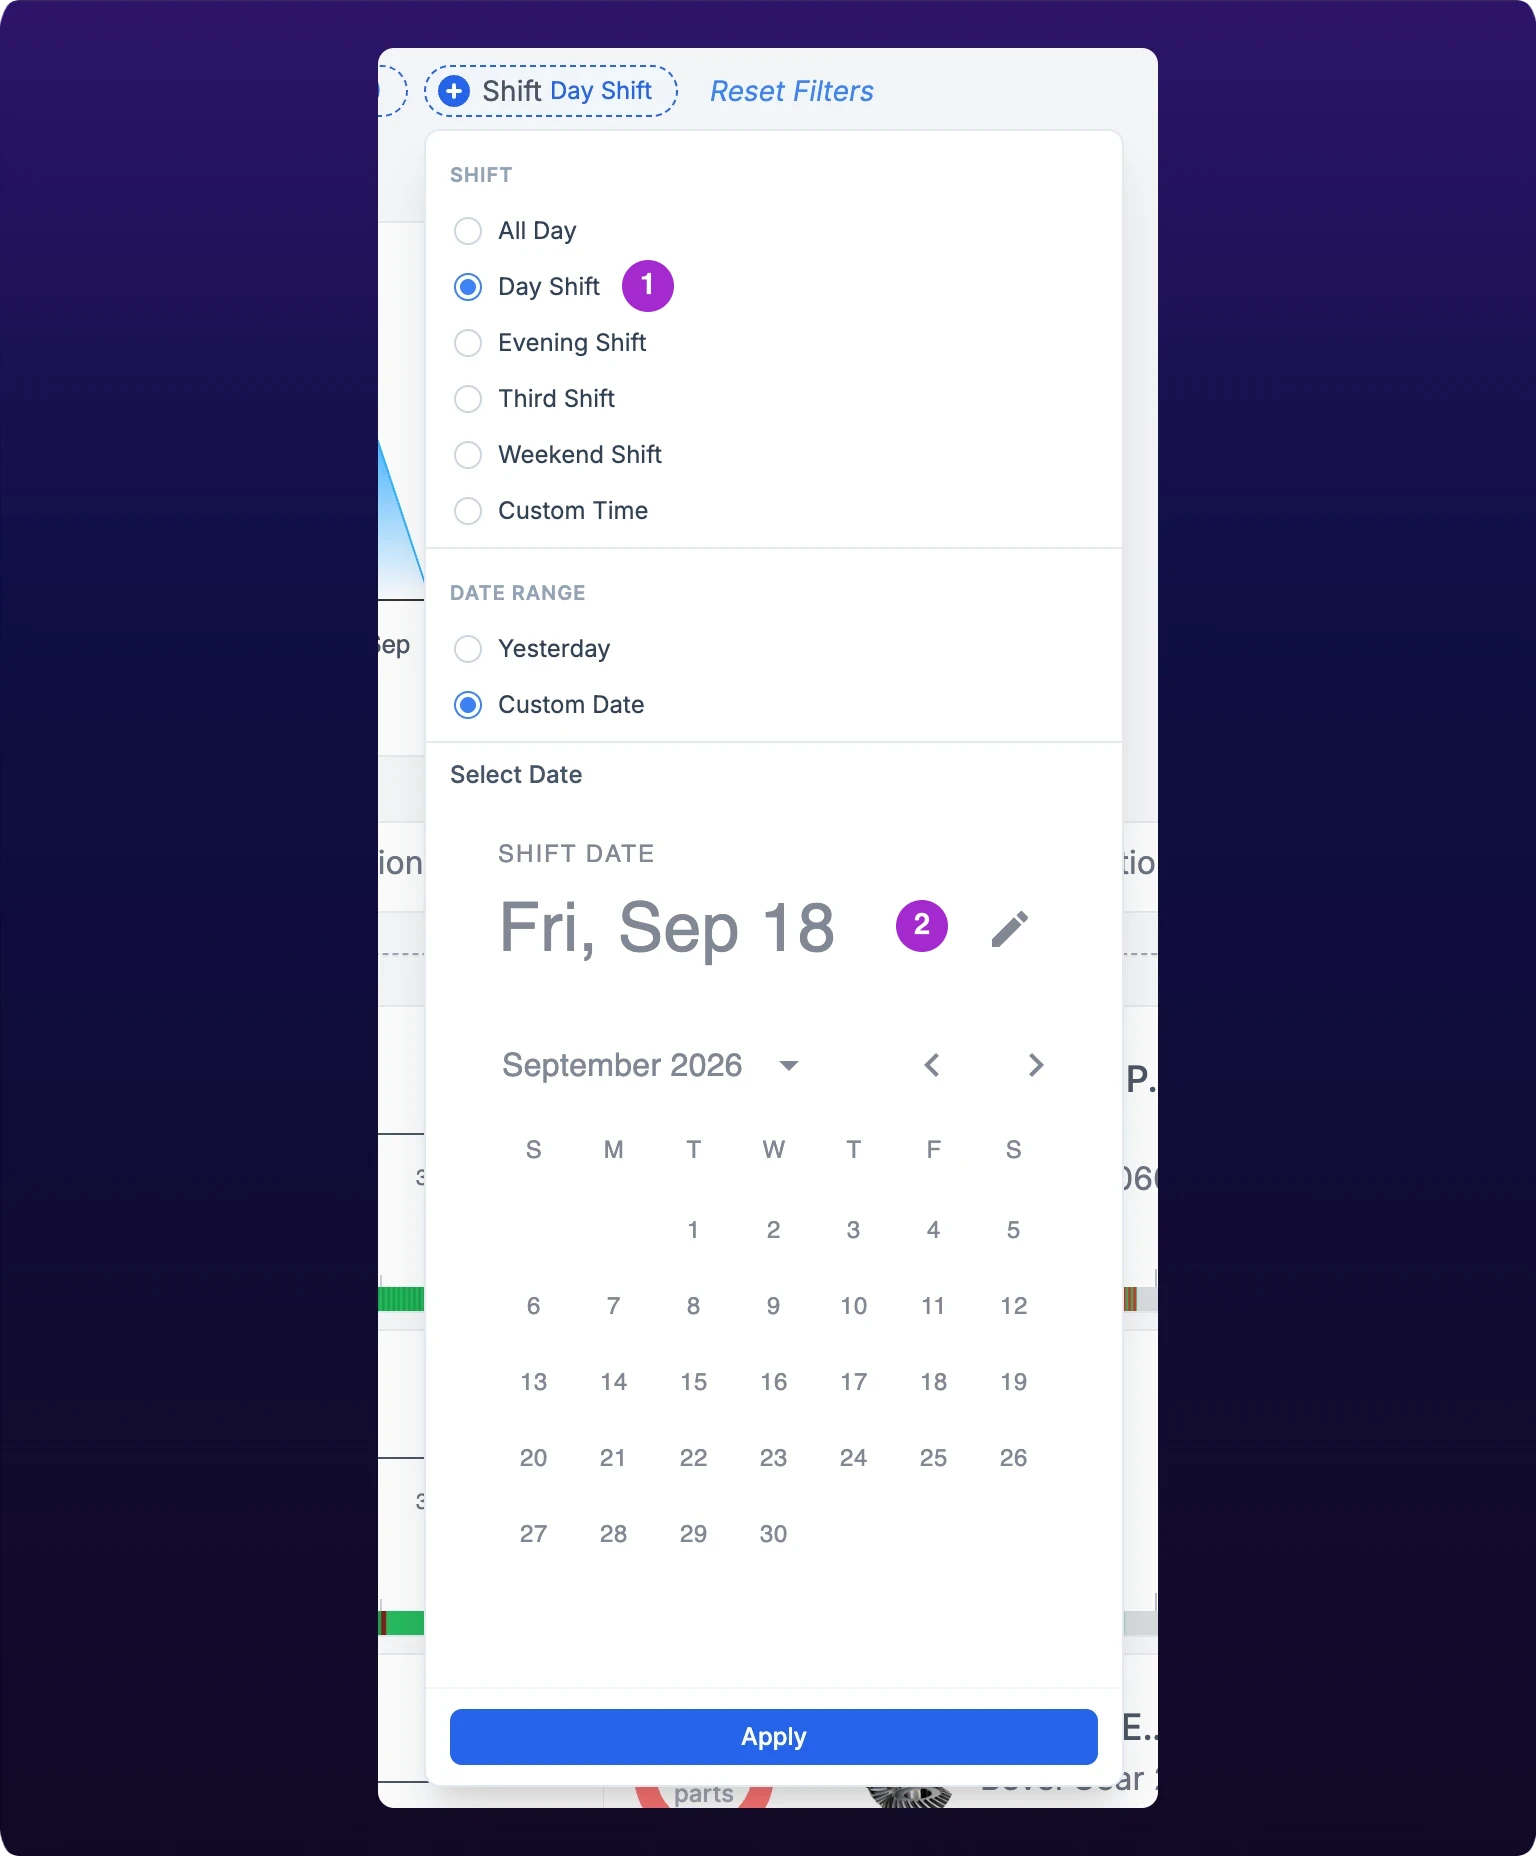 Pick the shift before the date. A day that spans three shifts averages away the shift that had the problem.
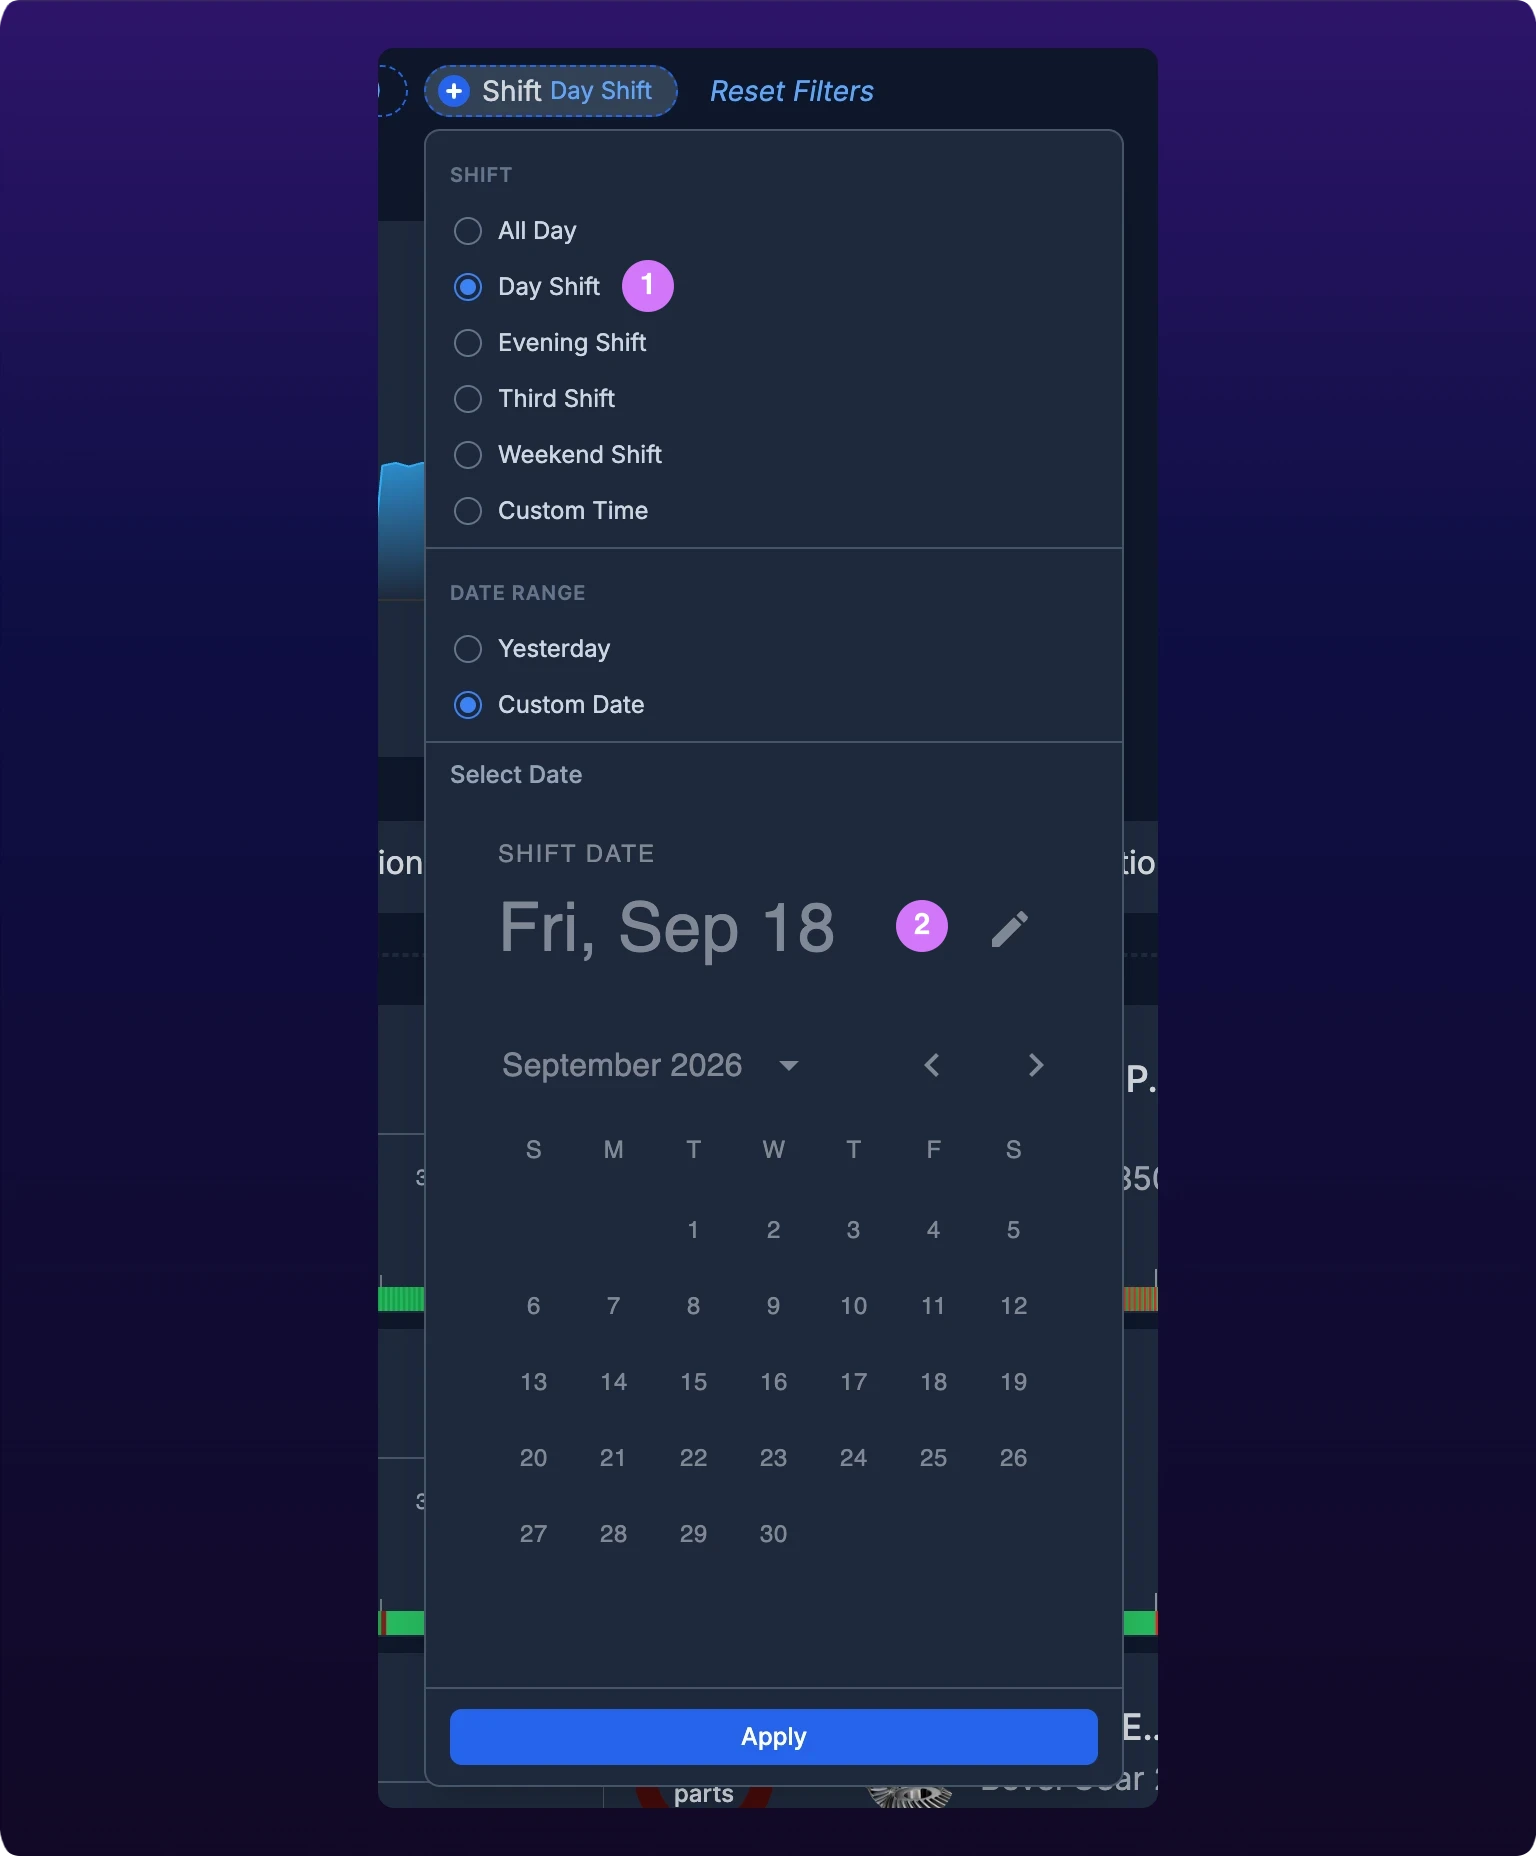
Read the shift view first, not the day view. All Day is also in the list, but a day that spans three shifts averages away the shift that had the problem. For example, a night shift at 40% utilization and two day shifts at 85% read as a 70% day.
If the list holds only All Day and Custom Time, no shifts have been defined yet. Define them first, on Shifts and time zone, then come back.
Read the four fleet KPIs
The four tiles total every machine on the page for the shift you picked.
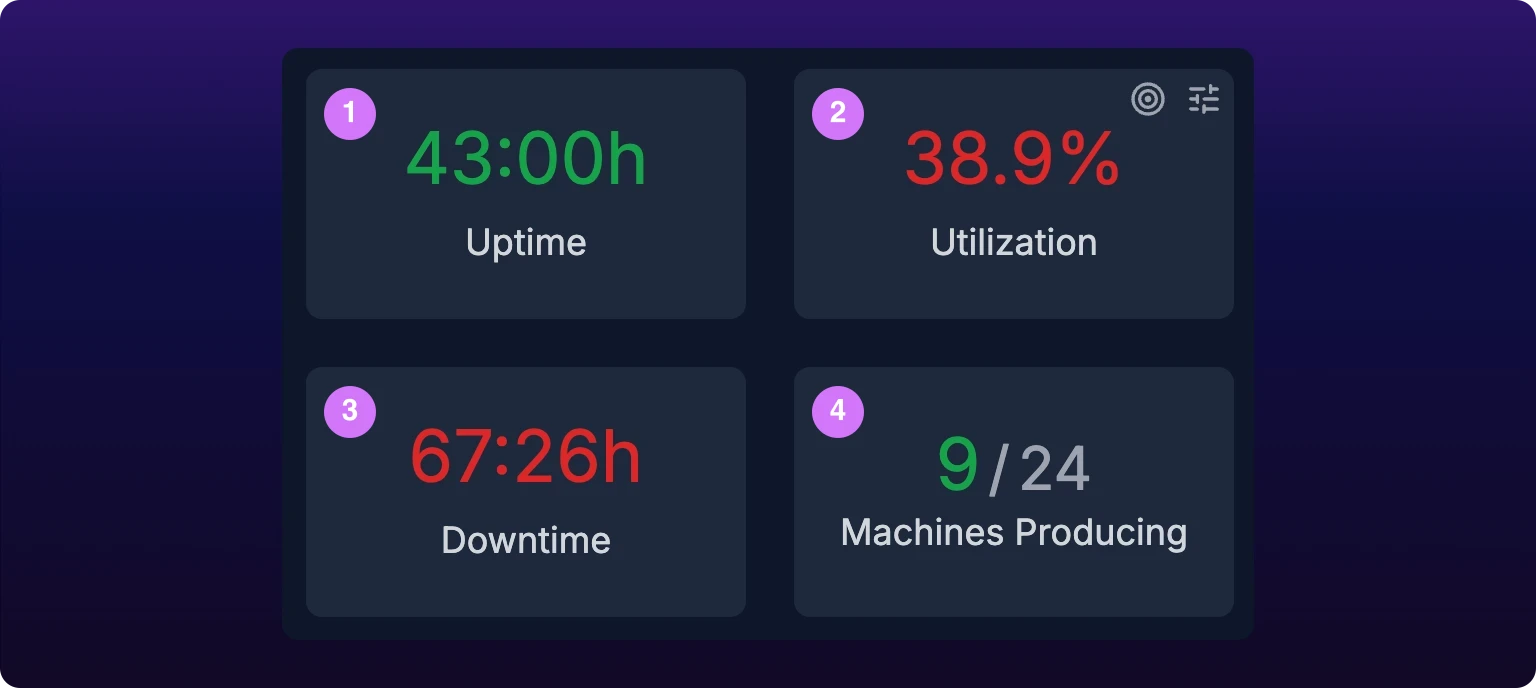
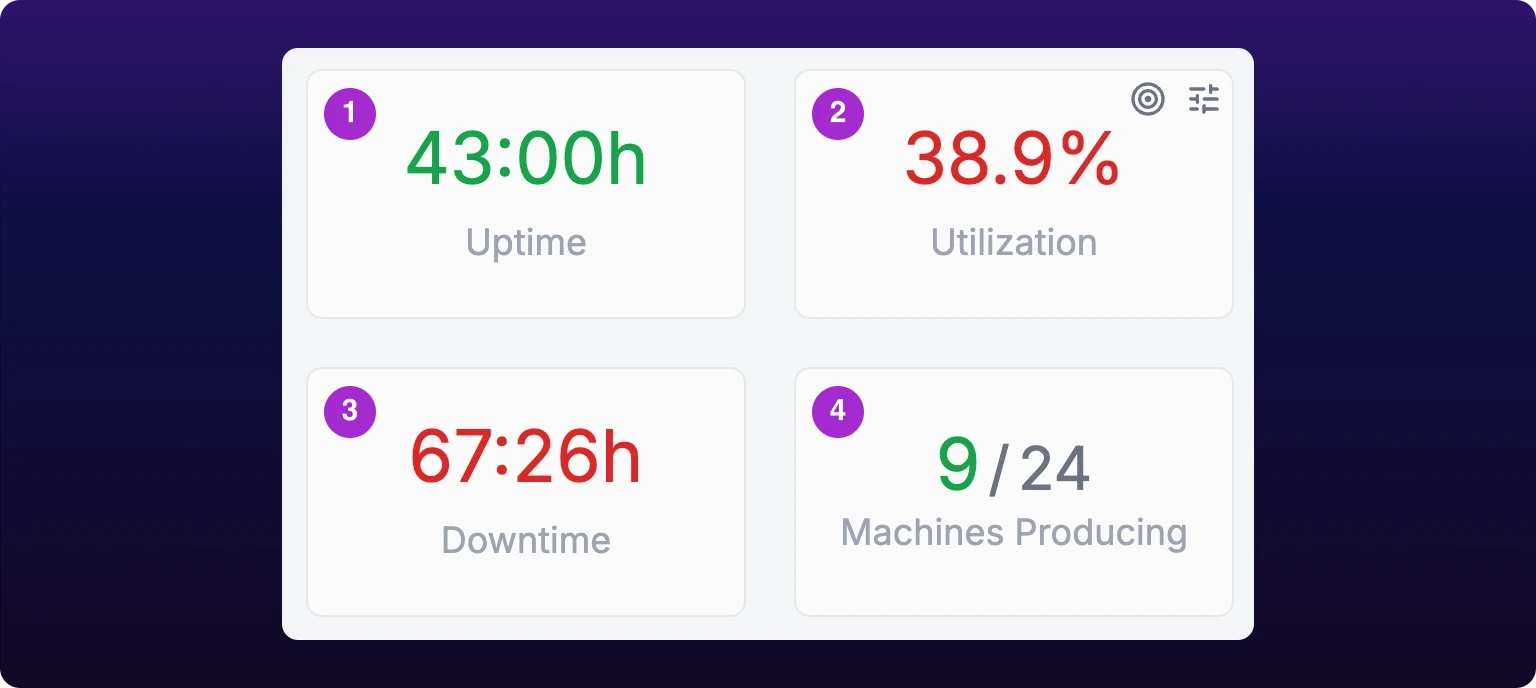 The four fleet KPIs: uptime, utilization, downtime and machines producing.
- Uptime is the hours every machine spent running this shift, added together.
- Utilization is uptime as a percentage of uptime plus downtime. It is green when it meets the organization's goal and red when it does not.
- Downtime is the hours every machine spent stopped, added together.
- Machines Producing is how many machines are running right now, over the total, as
8/14.
The first three describe the shift so far. The fourth describes this moment: a fleet can read 90% utilization and 2/14 producing at once, if a break started a minute ago.
Each metric is defined, with its formula, in Metrics.
Read one machine's card
Find the machine you know best and read its card. Two elements matter today; the rest is explained on Read a machine card.
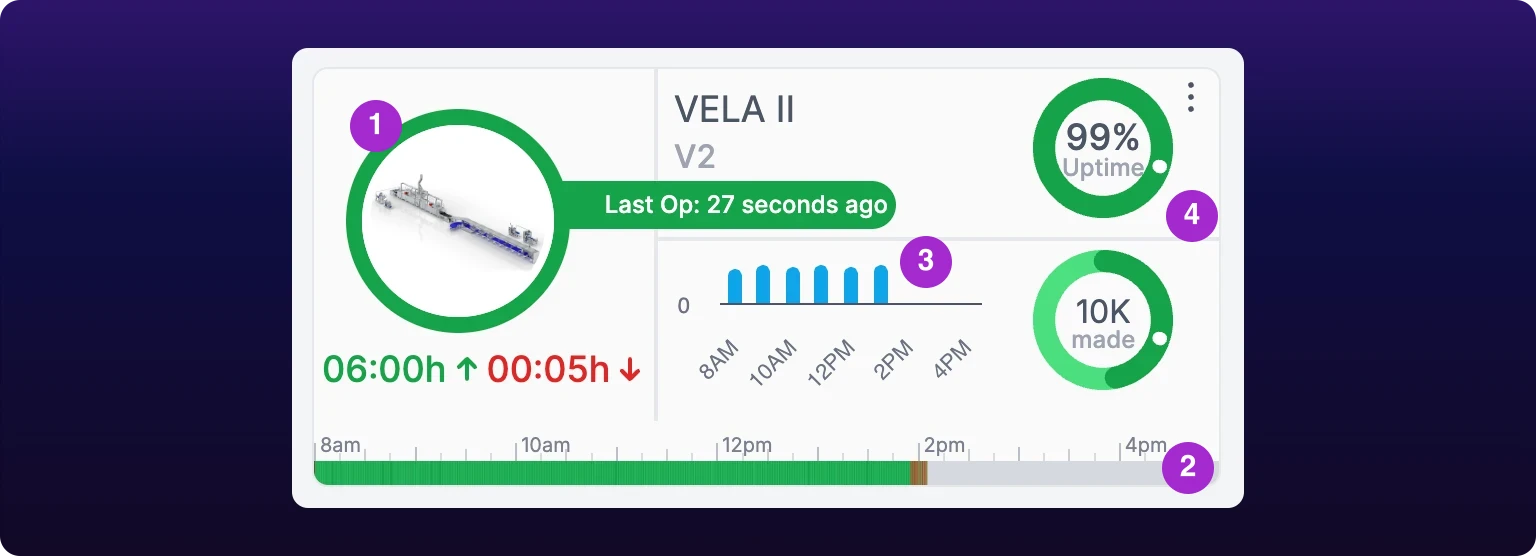 One machine's card. The ring is now, the bar is the shift so far.
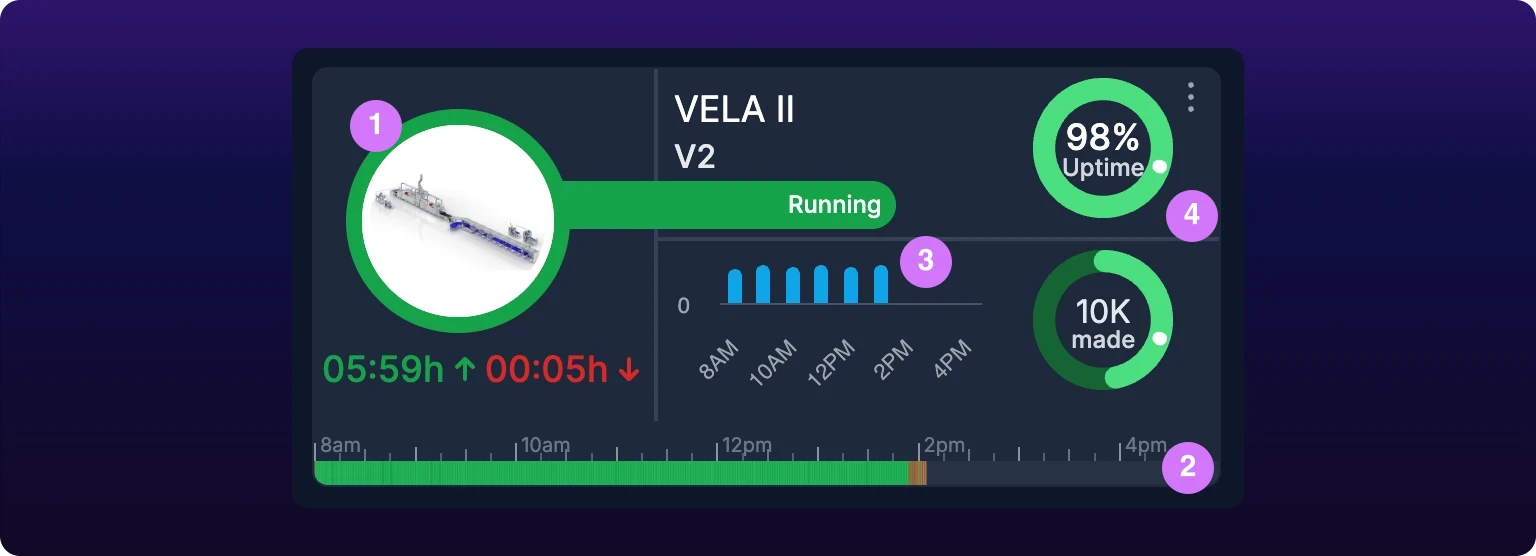
The status ring is the colored ring around the machine's photo. It shows the machine's state at this moment: green for running, orange or red for stopped, with red meaning it has been stopped longer. A sensor reports a machine as running or down, and nothing else; the colors add how long.
The shift status bar runs along the bottom of the card from the start of the shift to now, colored for the state the machine was in at each moment. The ring is now; the bar is the shift so far. Six short red stretches and one long one are the same downtime total and completely different problems.
Gray on the bar is not downtime. It means the sensor sent nothing for that stretch. A bar striped with gray is a connectivity problem, see Troubleshoot a device that is offline.
Open one stop
A stop is only a red stretch until someone says why it happened.
- Click the card. The machine's own page opens at
/assets/selected-asset/:id. - Find the status bar at the top of the page. It is the card's bar drawn wider.
- Click a red segment. A card opens showing the stop's start time and duration.
 Clicking a segment of the shift bar on the machine page opens that stop.

Give it a reason
A downtime category is a named reason for a stop, such as Tool Change or No Operator, chosen from a list your organization maintains. Classifying a stop attaches one category to it, so reports can rank reasons by the time they cost.
- On the stop's card, click the pencil icon. The Classify Downtime modal opens.
- Pick a category. They are grouped by severity, None to High.
- If the category is marked with an asterisk, type a note in Additional notes. The modal will not save without it.
- Click Classify.
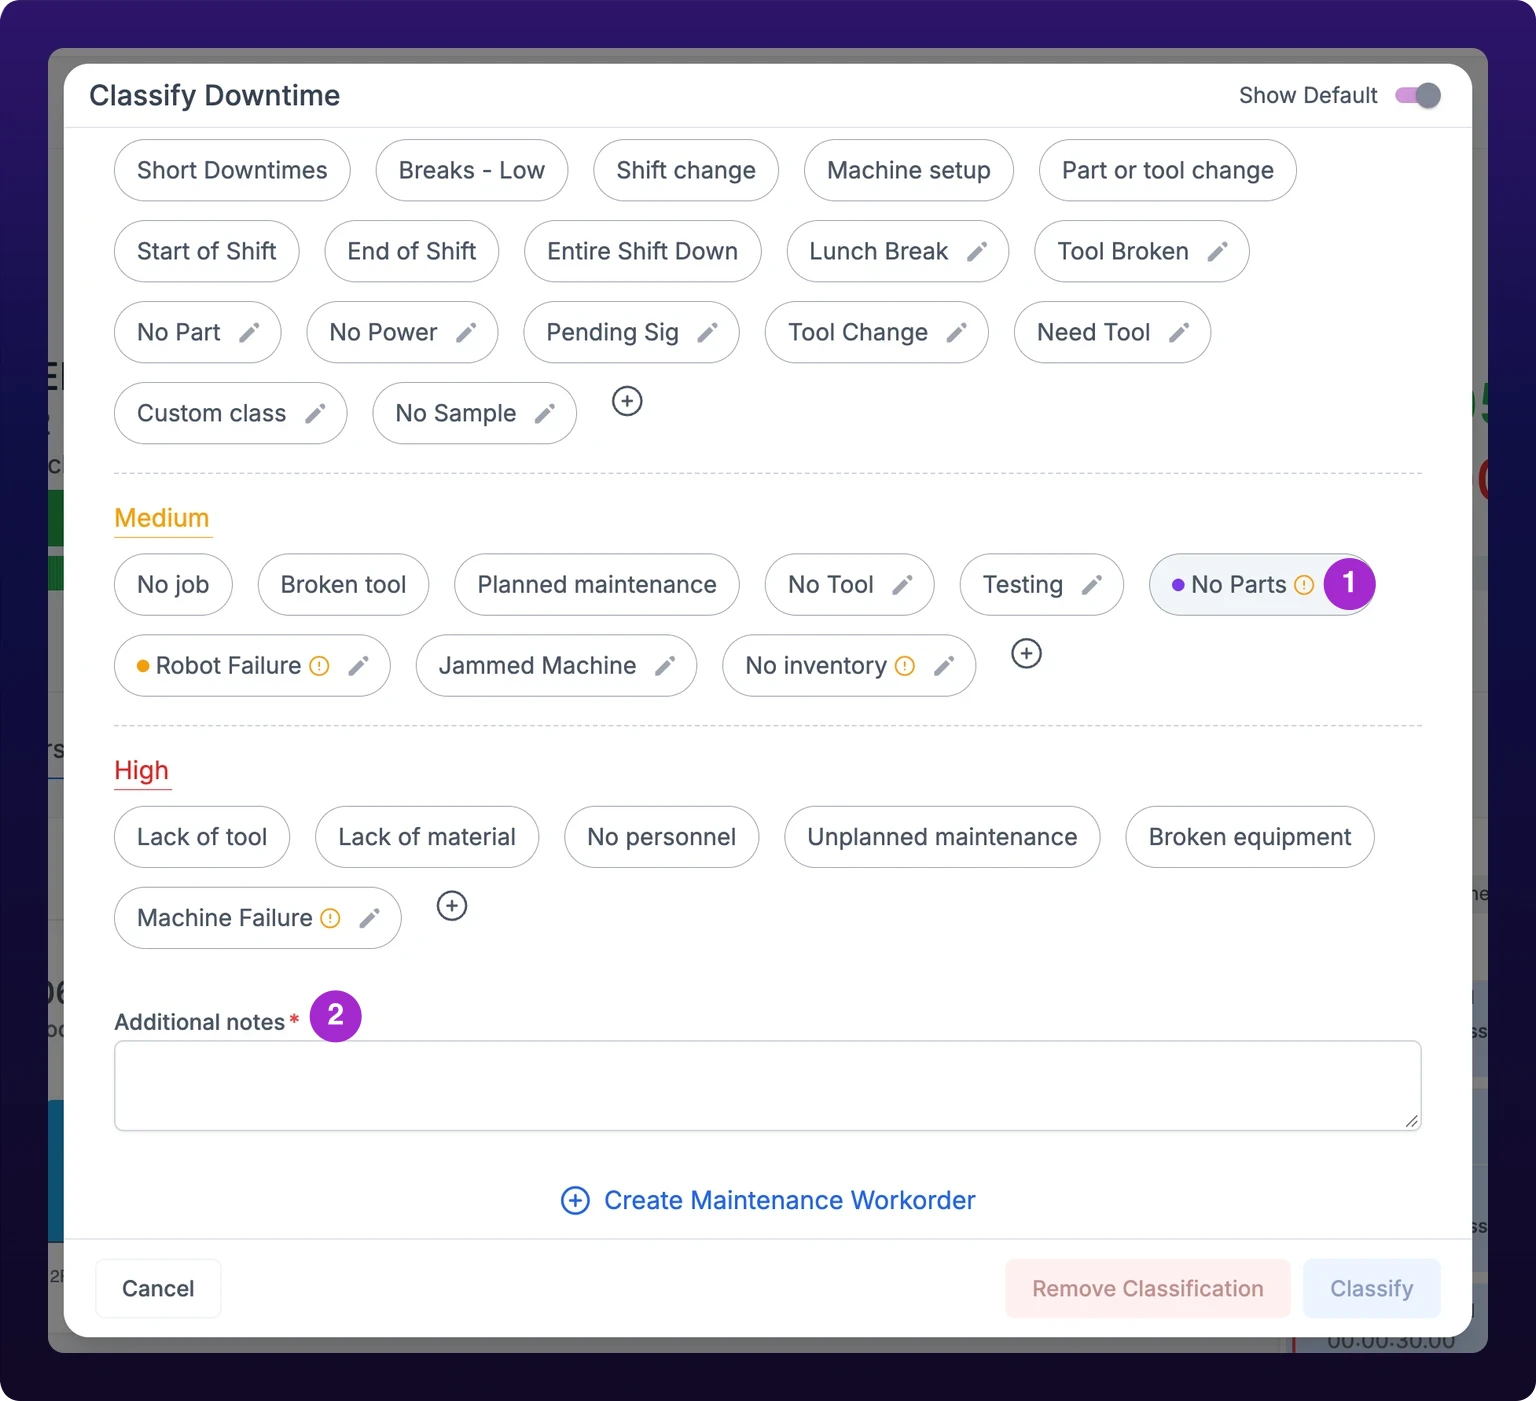 Giving a stop a reason. Some categories require a note before they will save.
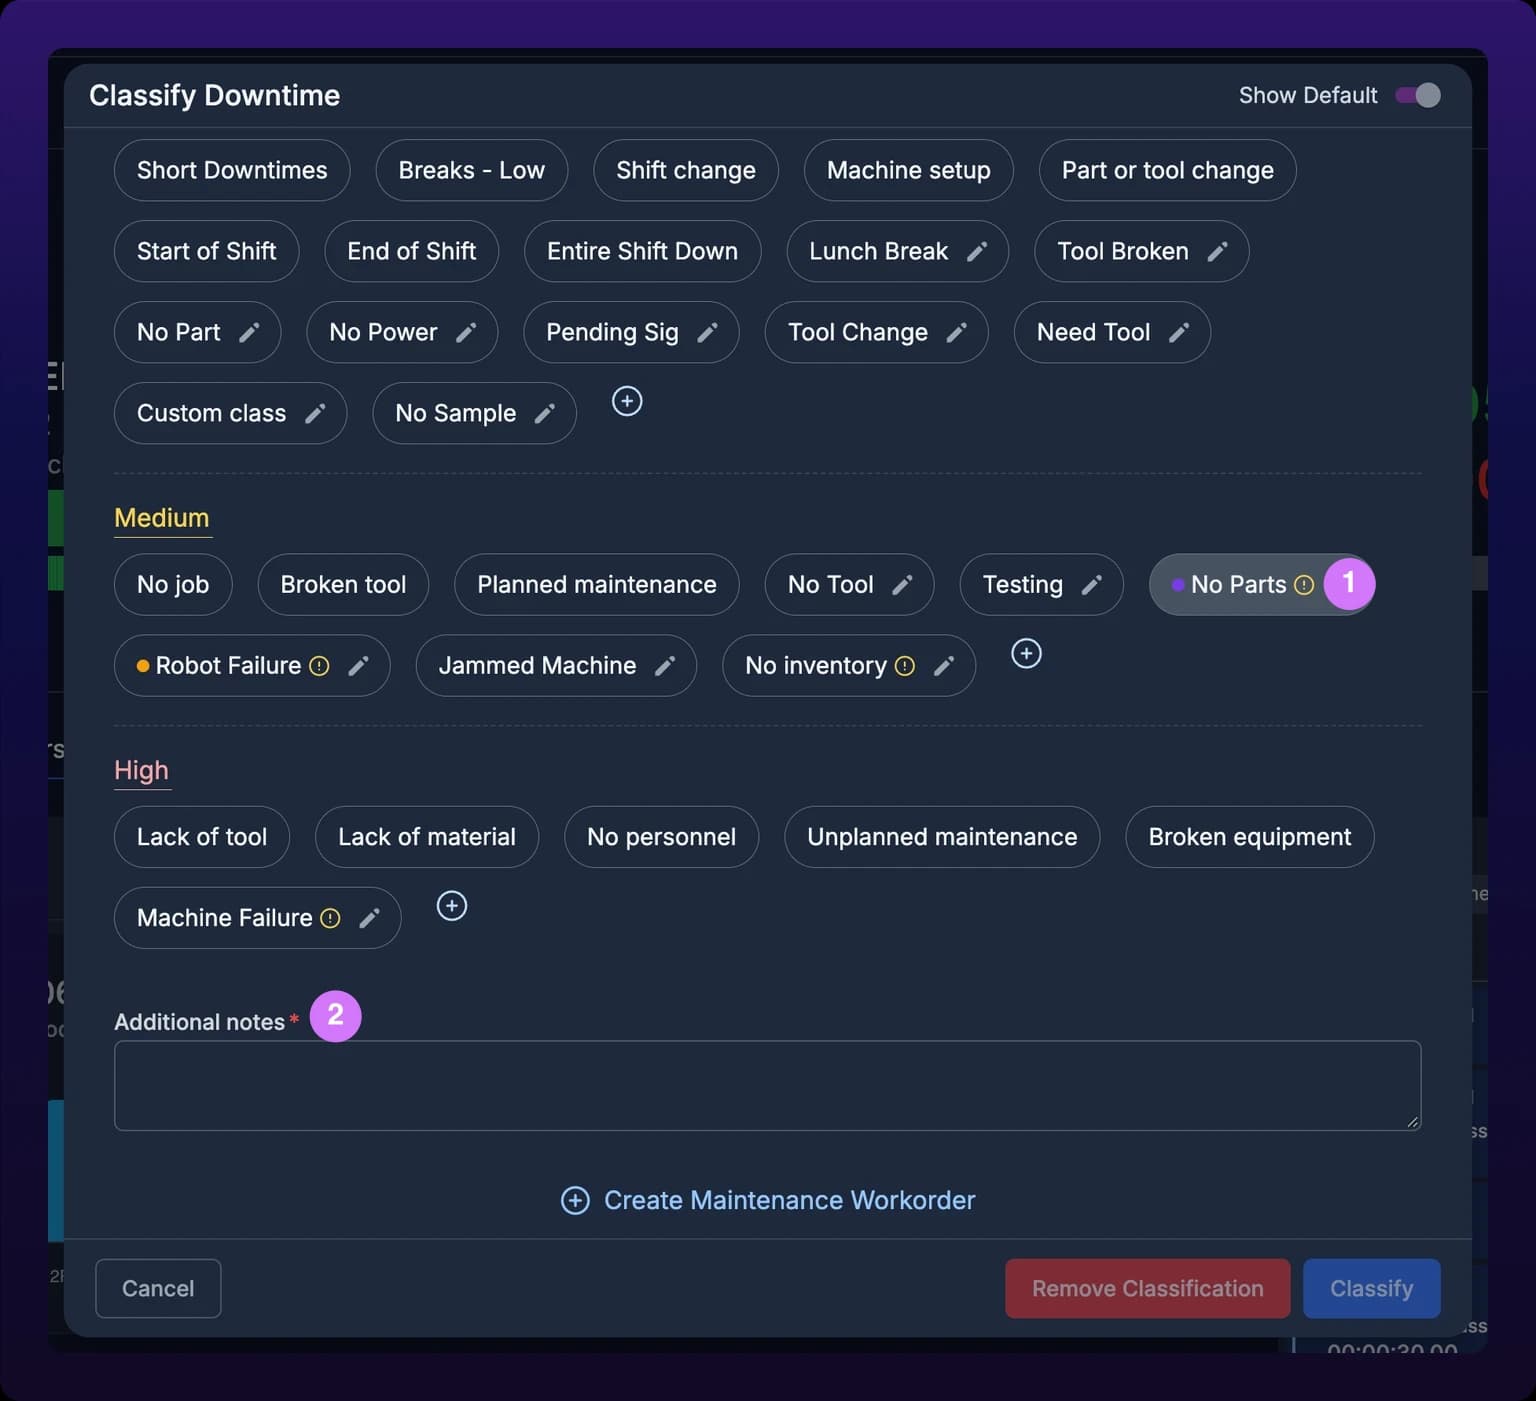
The segment turns dark red as soon as it saves. That is how a classified stop looks everywhere.
You do not need to classify every stop today. Stops under a minute, breaks, and the start and end of a shift can be classified for you by rules, see Automatic downtime rules. If the category list is empty or does not fit your floor, build it on Manage downtime categories.
What you just learned
You read one shift from the top down:
- The shift selector decides what every number counts. Shift first, then date.
- The four tiles total the fleet for the shift. Three describe the shift so far, one describes now.
- On a card, the ring is now and the bar is the shift so far. Gray on the bar is missing data, not downtime.
- A stop opens from the machine page's status bar, and a category is what turns it into a reason.
Every machine reads as stopped
If every card carries a red ring while the machines are running, the sensors do not yet know what running looks like on those machines. Set the running threshold on each one, see Set the running and stopping thresholds.
See also
What machine monitoring in IoTFlows answers and which page answers which question. Utilization, downtime and machine health come from the sensor alone; the parts gauge needs an ideal cycle time, and there is no combined OEE figure. Five views cover it: the Assets page for now and the current shift, the machine page for one machine, Downtimes for where the stopped time went, the Advanced Report for a month or quarter, and Canvas for a floor plan with live status. Shifts and the organization time zone must be set before any number is trustworthy.
The Assets page is the live view of every monitored machine in your organization. A KPI row totals uptime, downtime, utilization and how many machines are producing right now; a daily utilization trend sits beside it; and each machine gets a card carrying a status ring, an uptime gauge against its goal, hourly production against goal, and cycle time. Five view modes, saved to your account, trade detail against fleet size, and filters, grouping and a shift window decide what the page counts.