

Set status colors and downtime thresholds
Make the board's colors mean what your plant means by "a problem".
A sensor reports a machine as running or down, with nothing in between. The colors on the Assets page carry the part the state word cannot: how long the machine has been down. A threshold is that duration, a number of minutes counted from the moment the machine last ran.
You set two of them. The first turns a stopped machine orange, the second turns it red.
Before you start. Sign in as an Organization Owner or Organization Administrator, see Roles reference. Both thresholds and the red itself are organization-wide, so one setting covers every machine and every member.
Open status colors
- Open the Assets page at
/assets. - In the row of tiles across the top of the page, select the sliders icon in the top right corner of the Utilization tile, tooltipped Adjust Status Colors. It sits to the right of the target icon that sets the goal, see Set OEE and utilization goals.
- Type the two minute figures described below.
- Select Set.
IoTFlows confirms with "Status Colors Set" and every open board recolors. If the save fails, the toast carries the message the server returned and nothing was written. Reopen the dialog and read the numbers back before assuming the change took, see Troubleshoot wrong utilization or OEE.
The status colors
The dialog is headed Status Colors, over a panel reading Set Times for Asset Status Colors. A preview bar across the top shows the split you are building, the two large fields hold the thresholds in minutes, and the italic line underneath restates them as a sentence.
| Color | Means | Threshold | Where shown |
|---|---|---|---|
Green #16a34a | Running, or stopped for less time than the orange threshold | Below the orange threshold | Status pill, photo ring, card border, list row, Canvas tile |
Orange #d97706 | Stopped, and the stop is older than the orange threshold | Orange threshold up to the red one | The same |
Red, #dc2626 until you change it | Stopped past the red threshold, with no reason on the stop yet | Past the red threshold | The same |
Dark red #7f1d1d | Stopped, and the stop has been classified | None. It applies the moment a reason is saved | The same |
Gray #94a3b8 | The sensor sent nothing for that stretch | None | The shift status bar only |
A classified stop skips the thresholds. It draws dark red from the moment the reason is saved, rather than working through green and orange first, see Classify a downtime event. Dark red is only the default: where the category carries a color of its own, the stop draws in that color, see Change a color.
Gray is the absence of data rather than downtime. A bar striped with gray through a shift is a connectivity problem, not a machine that keeps stopping, and the card still reads stopped because it carries the last state the cloud recorded. See Troubleshoot a device that is offline.
You probably do not need to change the red. The swatch beside the red field opens a palette, and each color there has a light and a dark version so the board stays legible in both themes. Change it only where red already means something else on your floor, for example a plant whose andon lights reserve red for a safety stop.
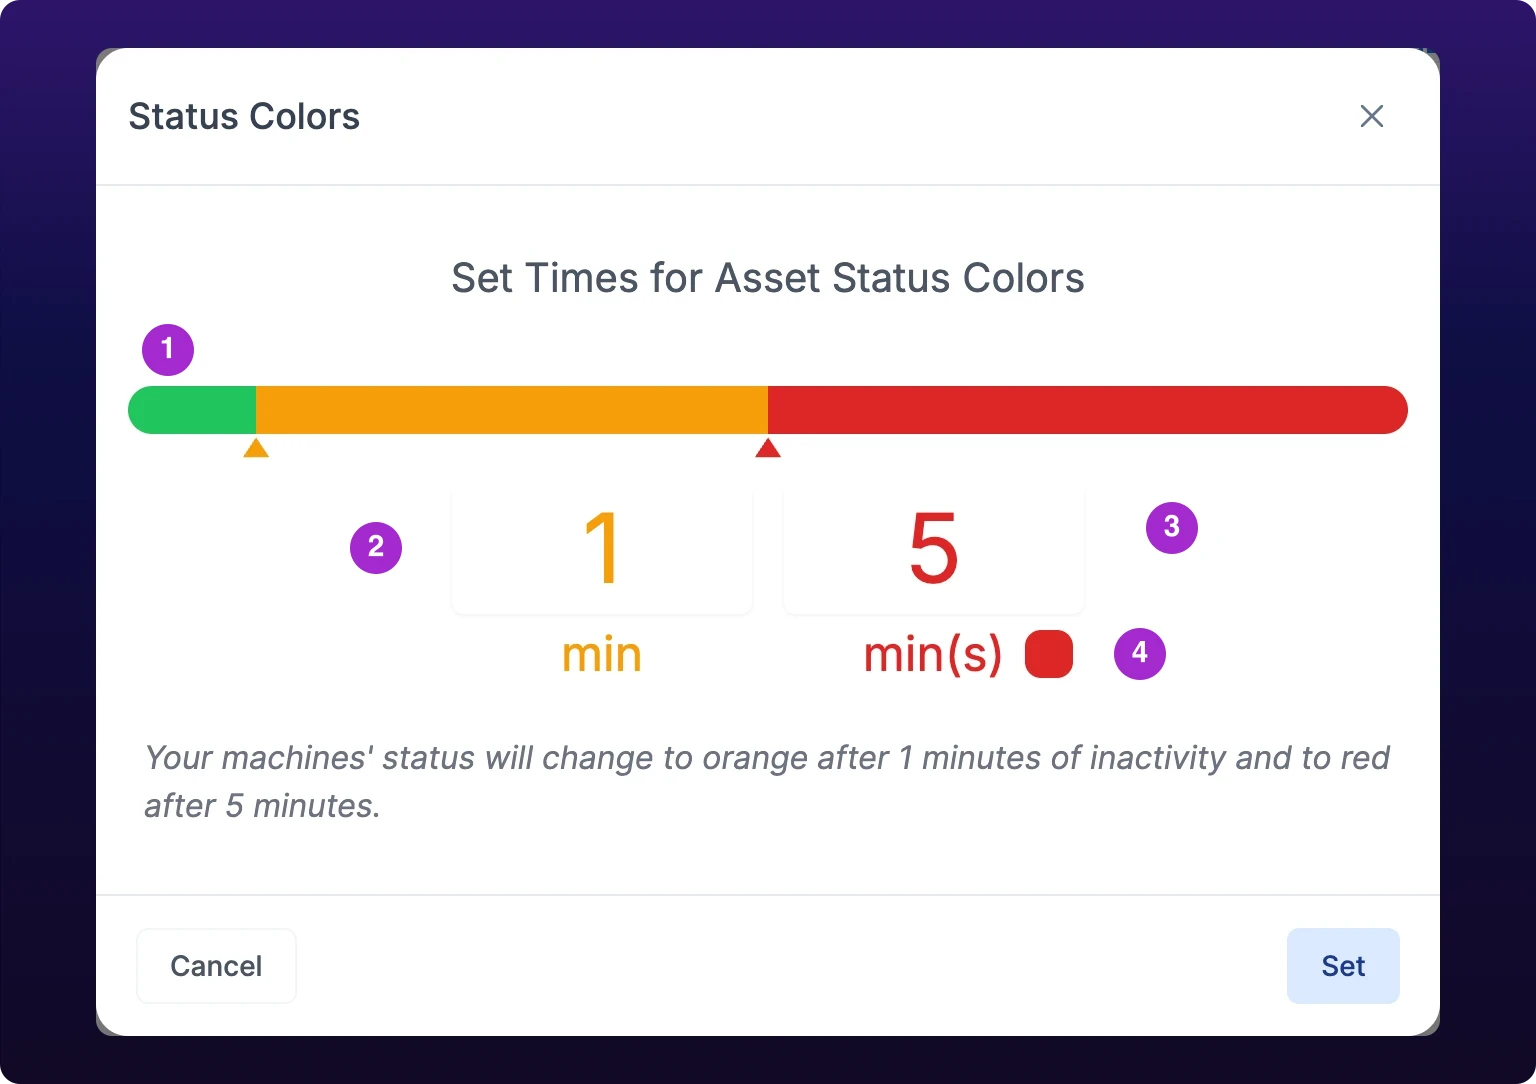 Status colors and the two downtime thresholds behind them.
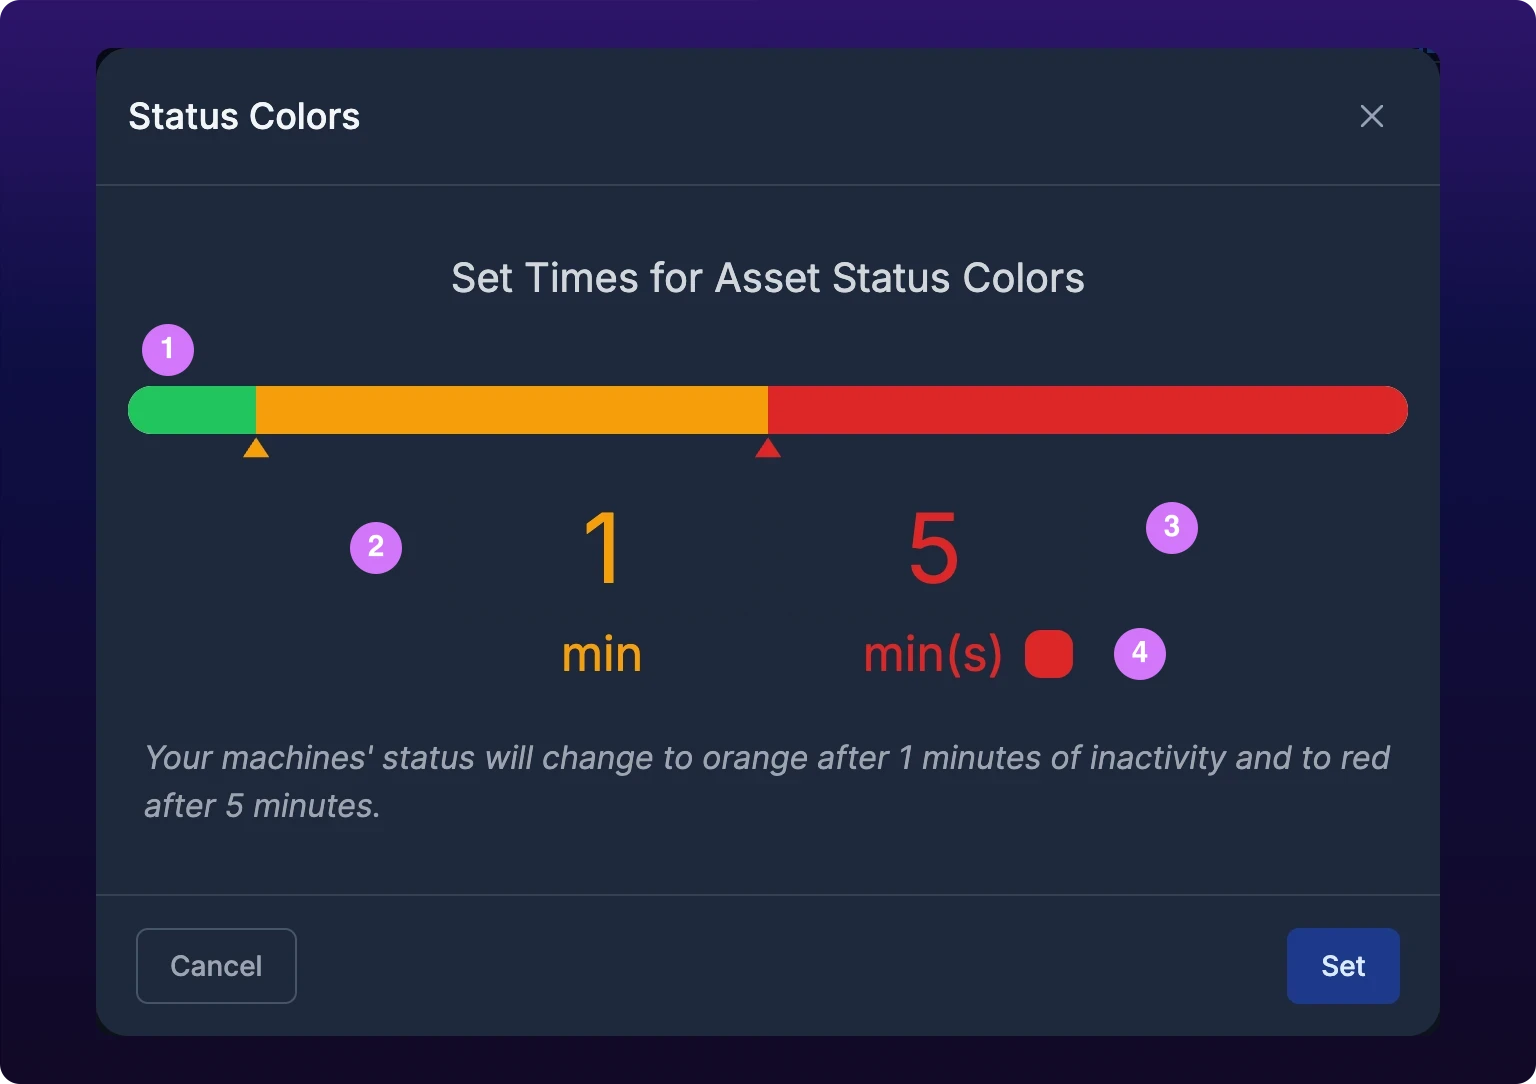
The orange threshold
Orange is the first warning. It is the left-hand field, and it defaults to one minute.
Set it near your normal changeover time. Orange should mean "this stop has run longer than a tool change". On a line that indexes in forty seconds, one minute is right; on a cell whose fixture swap takes six, one minute paints the board orange all shift.
A threshold of 0 colors the machine the moment a stop is recorded, which turns every gap between cycles into a warning. Nothing below your shortest routine stop is useful.
The red threshold
Red is the call to act. It is the right-hand field, it defaults to five minutes, and it is the one carrying the color swatch.
Set it at the point where someone should be walking to the machine. That is a decision about your floor rather than about the software: on a bottleneck cell it might be three minutes, on a machine that runs a two-hour program unattended it might be thirty.
The red threshold cannot sit below the orange one. Typing a smaller number snaps it back to the orange figure, and raising orange above red pushes red up to match.
Why is the board always green? Thresholds tuned so that almost nothing ever turns orange teach people not to look at the board. If a shift ends with no color on it, the numbers are too generous, not the plant too good. Compare them against a real shift on the Downtimes report, see Analyze downtime with Pareto and trend charts.
Where the colors appear
The thresholds are evaluated live in your browser, against the time since each machine last ran. They color:
- Every view on the Assets page, including the rows of a cascading group, see Monitor your fleet.
- The status pill and the photo ring in a machine's page header, see Inspect a single machine.
- Machine tiles on Canvas, see Map your floor with Canvas.
- Operator View, and machine cards and rows in the mobile app.
- A wallboard, because a wallboard is one of those views on a bigger screen, see Display a wallboard on a TV.
The thresholds never change a number. Uptime, downtime and utilization are the same whatever you set here, and no report, chart or export carries a color threshold at all. A stop of four minutes is four minutes of downtime whether the card was orange or red while it happened, see How each metric is calculated.
A color is not an alert. Nobody is notified when a machine turns red. The delay before IoTFlows sends a machine-down notification is a separate, per-machine setting, so a plant that wants to be told about long stops sets that as well, see Set alert rules for a machine.
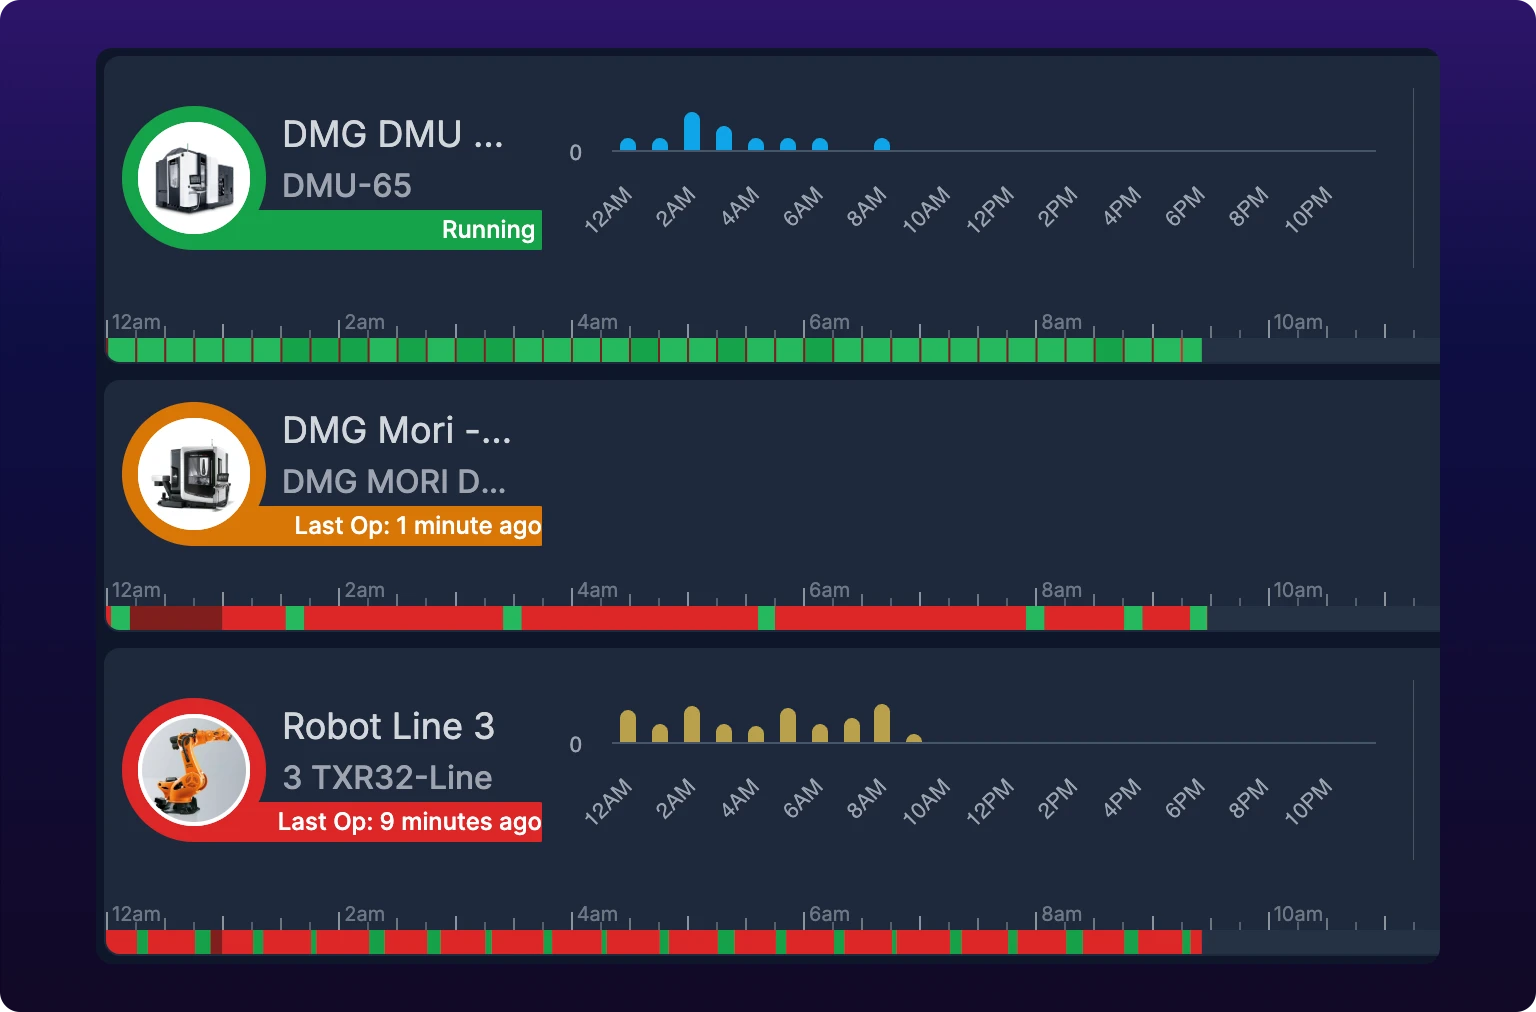
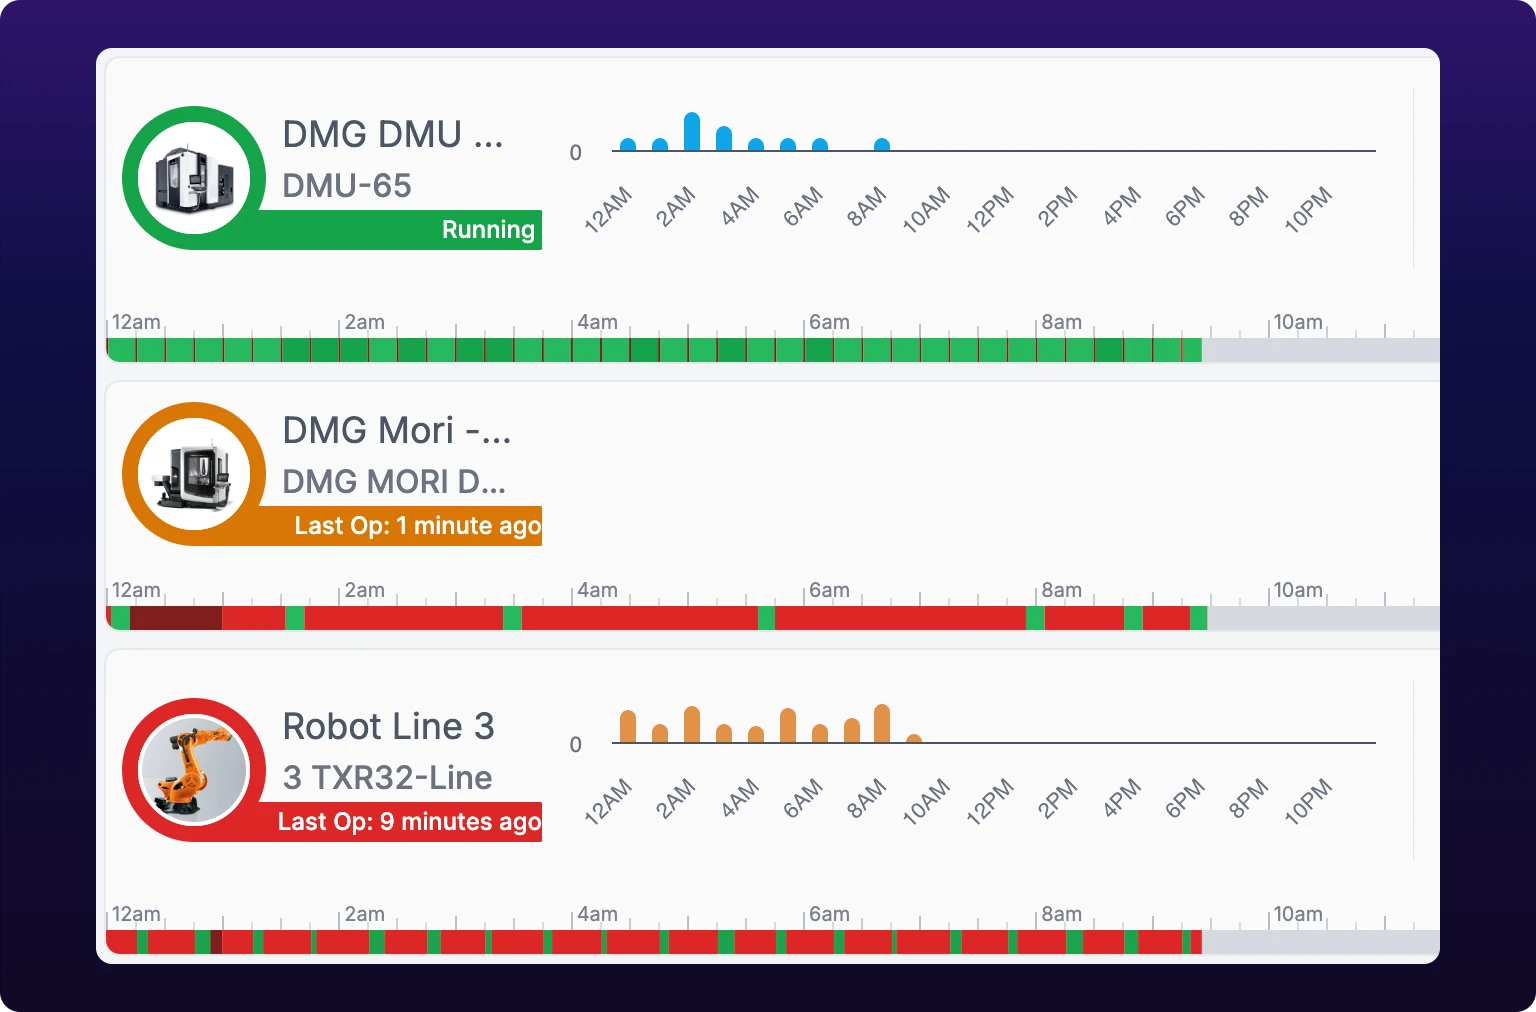 The same stop at three ages: green under the first threshold, orange past it, and red past the second.
See also
From the blog
One percentage colors every gauge in IoTFlows. Set the organization goal from the Utilization tile on the Assets page, override it on the machines whose realistic ceiling genuinely differs by turning on Set Custom Utilization / OEE Goal in a machine's Uptime gauge, and read the table of which surface uses which goal. The coloring is binary, green at or above and red below, with no orange; the same percentage also colors the parts and cycle gauges; and the comparison is computed across the whole window you are viewing rather than averaged per shift. Owner or Administrator.
The definition behind every number IoTFlows shows and what each one leaves out. Uptime is availability, running time over running plus stopped, and is the number the interface has labeled OEE. Unknown time and None-severity breaks sit outside both uptime and downtime. The parts gauge measures output against the ideal cycle time, FPY compares a step's count to the first step's in a cascade, and every window is calculated whole rather than averaged per shift. Quality comes from the scrap your team logs against a job, and there is no combined OEE figure.